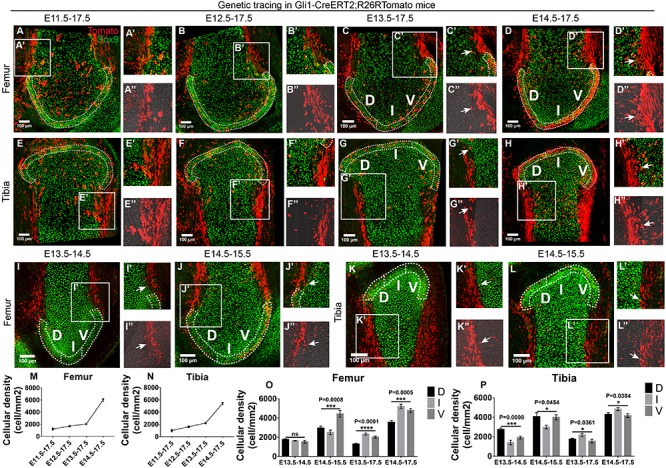
FIGURE 5.

Gli1-expressing cells along the skeletal edges give rise to the periarticular region of epiphyseal surface. (A–L) Example images of lineage tracings in Gli1-CreERT2;R26RTomato mice at the knee joint surface. Sox9 staining was added to help define the cartilage. (M,N) Increased density of Gli1-positive cells were found in the periarticular region when tracing was started at later time points. (O,P) Gli1-positive cells proliferate from the dorsal (D) and ventral (V) edges of the epiphyseal surface toward the intercondylar eminence (I) when cavitation has completed. Data represent mean ± SEM where at least four embryos were analyzed. The white dashed lines outline the periarticular region of the epiphyseal surface. Arrows in the insets of (C,D,G–L) point to the Tomato and Sox9 double positive perichondrial cells. Insets labeled with double apostrophe marks show Tomato only (A–L). *P < 0.05, ***P < 0.005, ****P < 0.001, ns, not significant.
