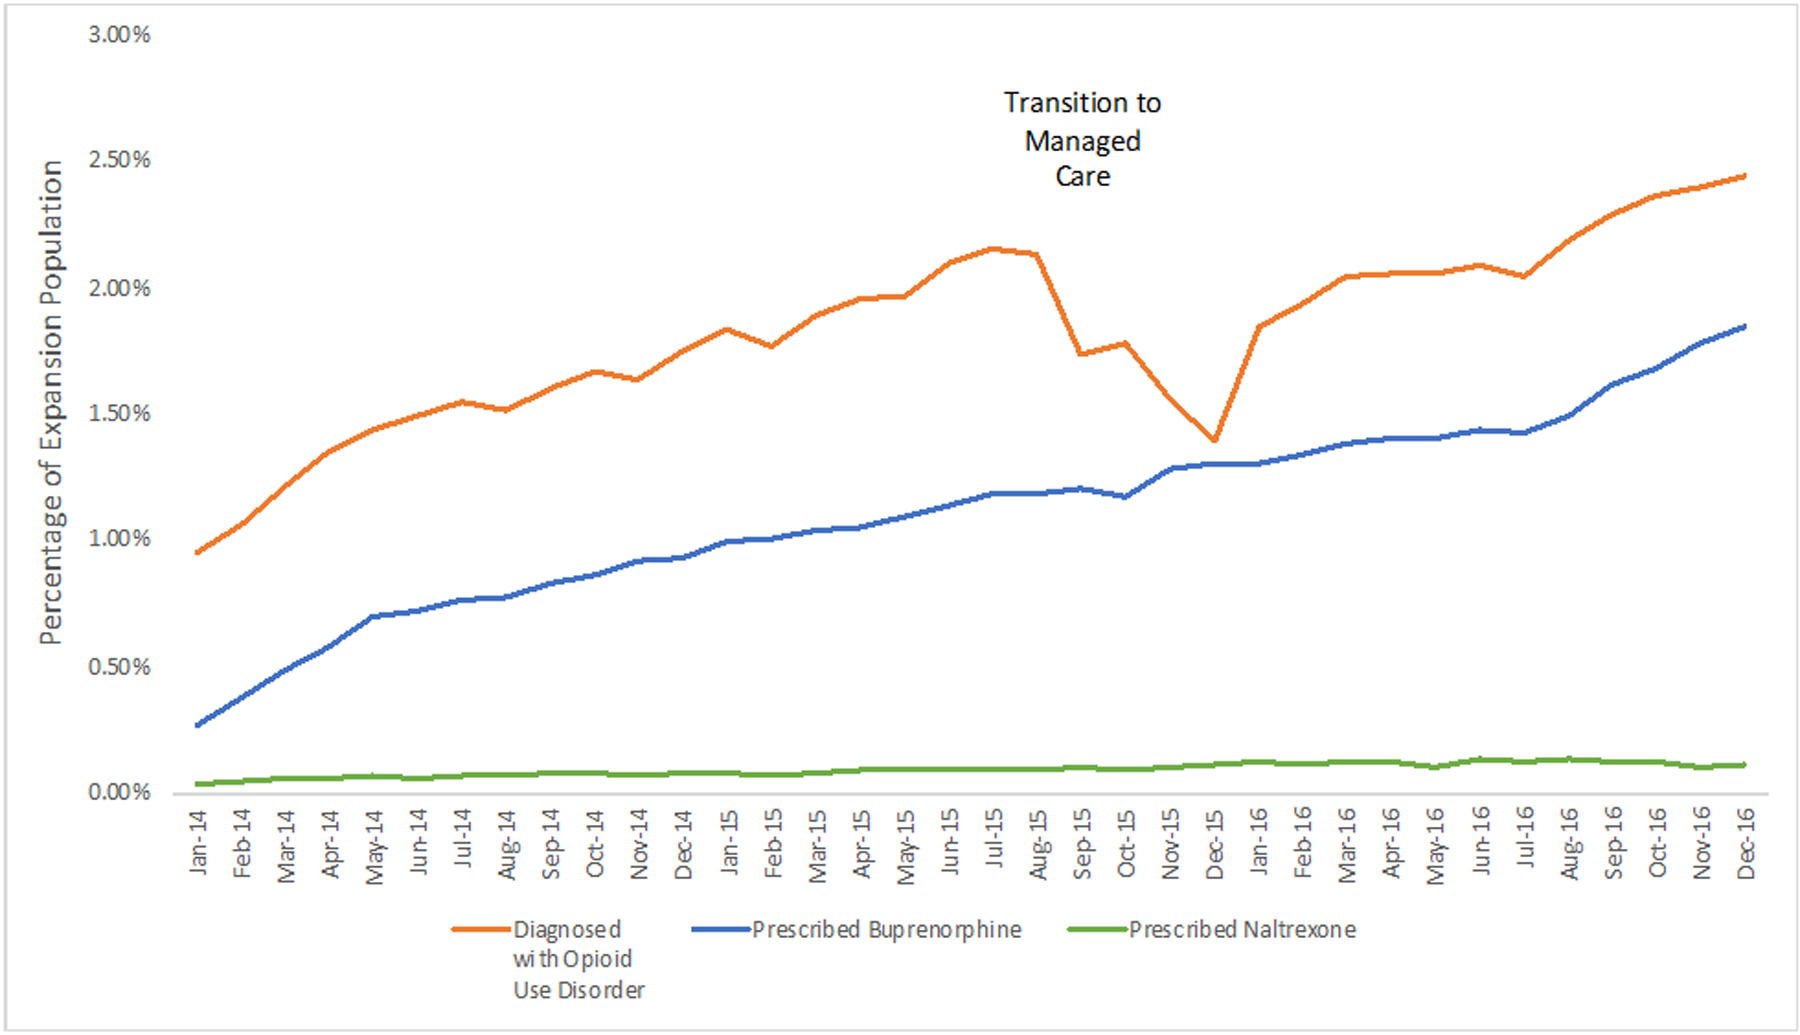
Exhibit 2. Monthly Percentages of the Medicaid Expansion Population with an OUD Diagnosis and Receiving Buprenorphine or Naltrexone.

Source: Authors’ analysis of West Virginia Medicaid expansion claims data 2014–2016.
Notes: Monthly average are calculated as the percentage of all Medicaid expansion enrollees in the month with either a claim that included a diagnosis for an opioid use disorder, a prescription filled for buprenorphine, or a prescription filled for naltrexone. The gray box indicates the period when the state transitioned the Medicaid expansion population from fee-for-service to managed care.
| Month | Diagnosed with Opioid Use Disorder | Prescribed Buprenorphine | Prescribed Naltrexone |
|---|---|---|---|
| Jan-14 | 0.90% | 0.27% | 0.04% |
| Feb-14 | 1.02% | 0.38% | 0.05% |
| Mar-14 | 1.18% | 0.49% | 0.06% |
| Apr-14 | 1.30% | 0.58% | 0.05% |
| May-14 | 1.39% | 0.69% | 0.07% |
| Jun-14 | 1.46% | 0.72% | 0.06% |
| Jul-14 | 1.50% | 0.76% | 0.07% |
| Aug-14 | 1.48% | 0.78% | 0.07% |
| Sep-14 | 1.56% | 0.83% | 0.08% |
| Oct-14 | 1.63% | 0.87% | 0.08% |
| Nov-14 | 1.60% | 0.92% | 0.07% |
| Dec-14 | 1.70% | 0.93% | 0.08% |
| Jan-15 | 1.80% | 1.00% | 0.08% |
| Feb-15 | 1.73% | 1.01% | 0.07% |
| Mar-15 | 1.84% | 1.04% | 0.08% |
| Apr-15 | 1.92% | 1.05% | 0.09% |
| May-15 | 1.93% | 1.09% | 0.09% |
| Jun-15 | 2.06% | 1.13% | 0.10% |
| Jul-15 | 2.11% | 1.18% | 0.09% |
| Aug-15 | 2.10% | 1.18% | 0.09% |
| Sep-15 | 1.70% | 1.21% | 0.10% |
| Oct-15 | 1.77% | 1.17% | 0.09% |
| Nov-15 | 1.55% | 1.28% | 0.10% |
| Dec-15 | 1.39% | 1.30% | 0.11% |
| Jan-16 | 1.84% | 1.30% | 0.12% |
| Feb-16 | 1.93% | 1.34% | 0.11% |
| Mar-16 | 2.04% | 1.38% | 0.12% |
| Apr-16 | 2.05% | 1.41% | 0.13% |
| May-16 | 2.06% | 1.40% | 0.10% |
| Jun-16 | 2.09% | 1.43% | 0.13% |
| Jul-16 | 2.05% | 1.42% | 0.12% |
| Aug-16 | 2.18% | 1.49% | 0.14% |
| Sep-16 | 2.29% | 1.61% | 0.12% |
| Oct-16 | 2.36% | 1.67% | 0.13% |
| Nov-16 | 2.39% | 1.77% | 0.11% |
| Dec-16 | 2.44% | 1.84% | 0.11% |
