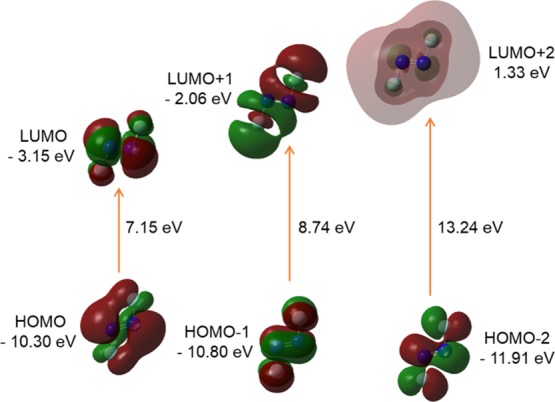
Figure 12.

FMO orbitals (isovalue: 0.02 [e bohr–3]1/2 of trans-DFDZ generated from TD/DFT calculation). Green and Maroon colors depict different phases.

FMO orbitals (isovalue: 0.02 [e bohr–3]1/2 of trans-DFDZ generated from TD/DFT calculation). Green and Maroon colors depict different phases.