
Figure 12.
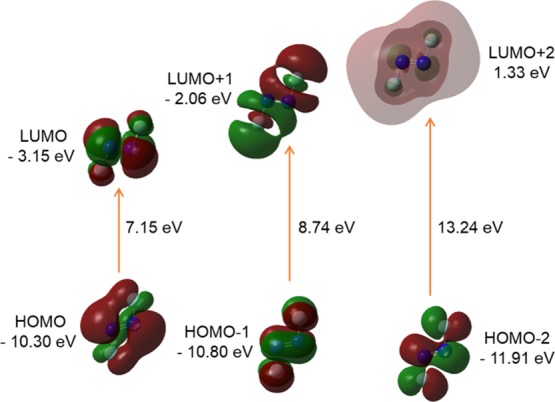
FMO orbitals (isovalue: 0.02 [e bohr–3]1/2 of trans-DFDZ generated from TD/DFT calculation). Green and Maroon colors depict different phases.
Official websites use .gov
A
.gov website belongs to an official
government organization in the United States.
Secure .gov websites use HTTPS
A lock (
) or https:// means you've safely
connected to the .gov website. Share sensitive
information only on official, secure websites.
FMO orbitals (isovalue: 0.02 [e bohr–3]1/2 of trans-DFDZ generated from TD/DFT calculation). Green and Maroon colors depict different phases.