. 2019 Oct 15;10(47):10900–10910. doi: 10.1039/c9sc04389f

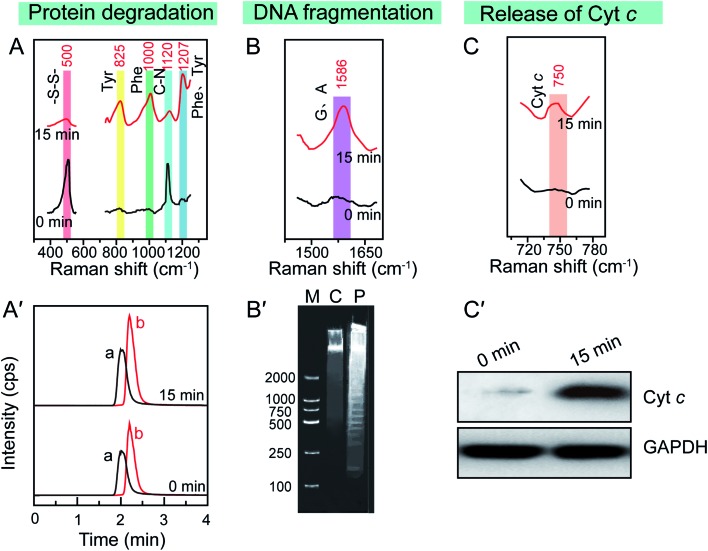
Fig. 4. Typical apoptotic molecular events in PPTT-induced apoptosis. In situ reference Raman bands of (A) protein degradation, (B) DNA fragmentation, and (C) release of cytochrome c in the SERS spectra of MCF-7 cells before (up) and after (bottom) PPTT. (A′) LC-MS analysis of Phe and Tyr extracted from MCF-7 cells before (up) and after (bottom) PPTT. (B′) Agarose gel electrophoresis of DNA extracted from MCF-7 cells before and after PPTT. (C′) Agarose gel electrophoresis of DNA fragments. Lane M: DNA ladder mark in the range of 100–2000 bp, lane C: control (DNA fragments extracted from MCF-7 cells before PPTT), lane P: DNA fragments extracted from MCF-7 cells after PPTT.

Fig. 4