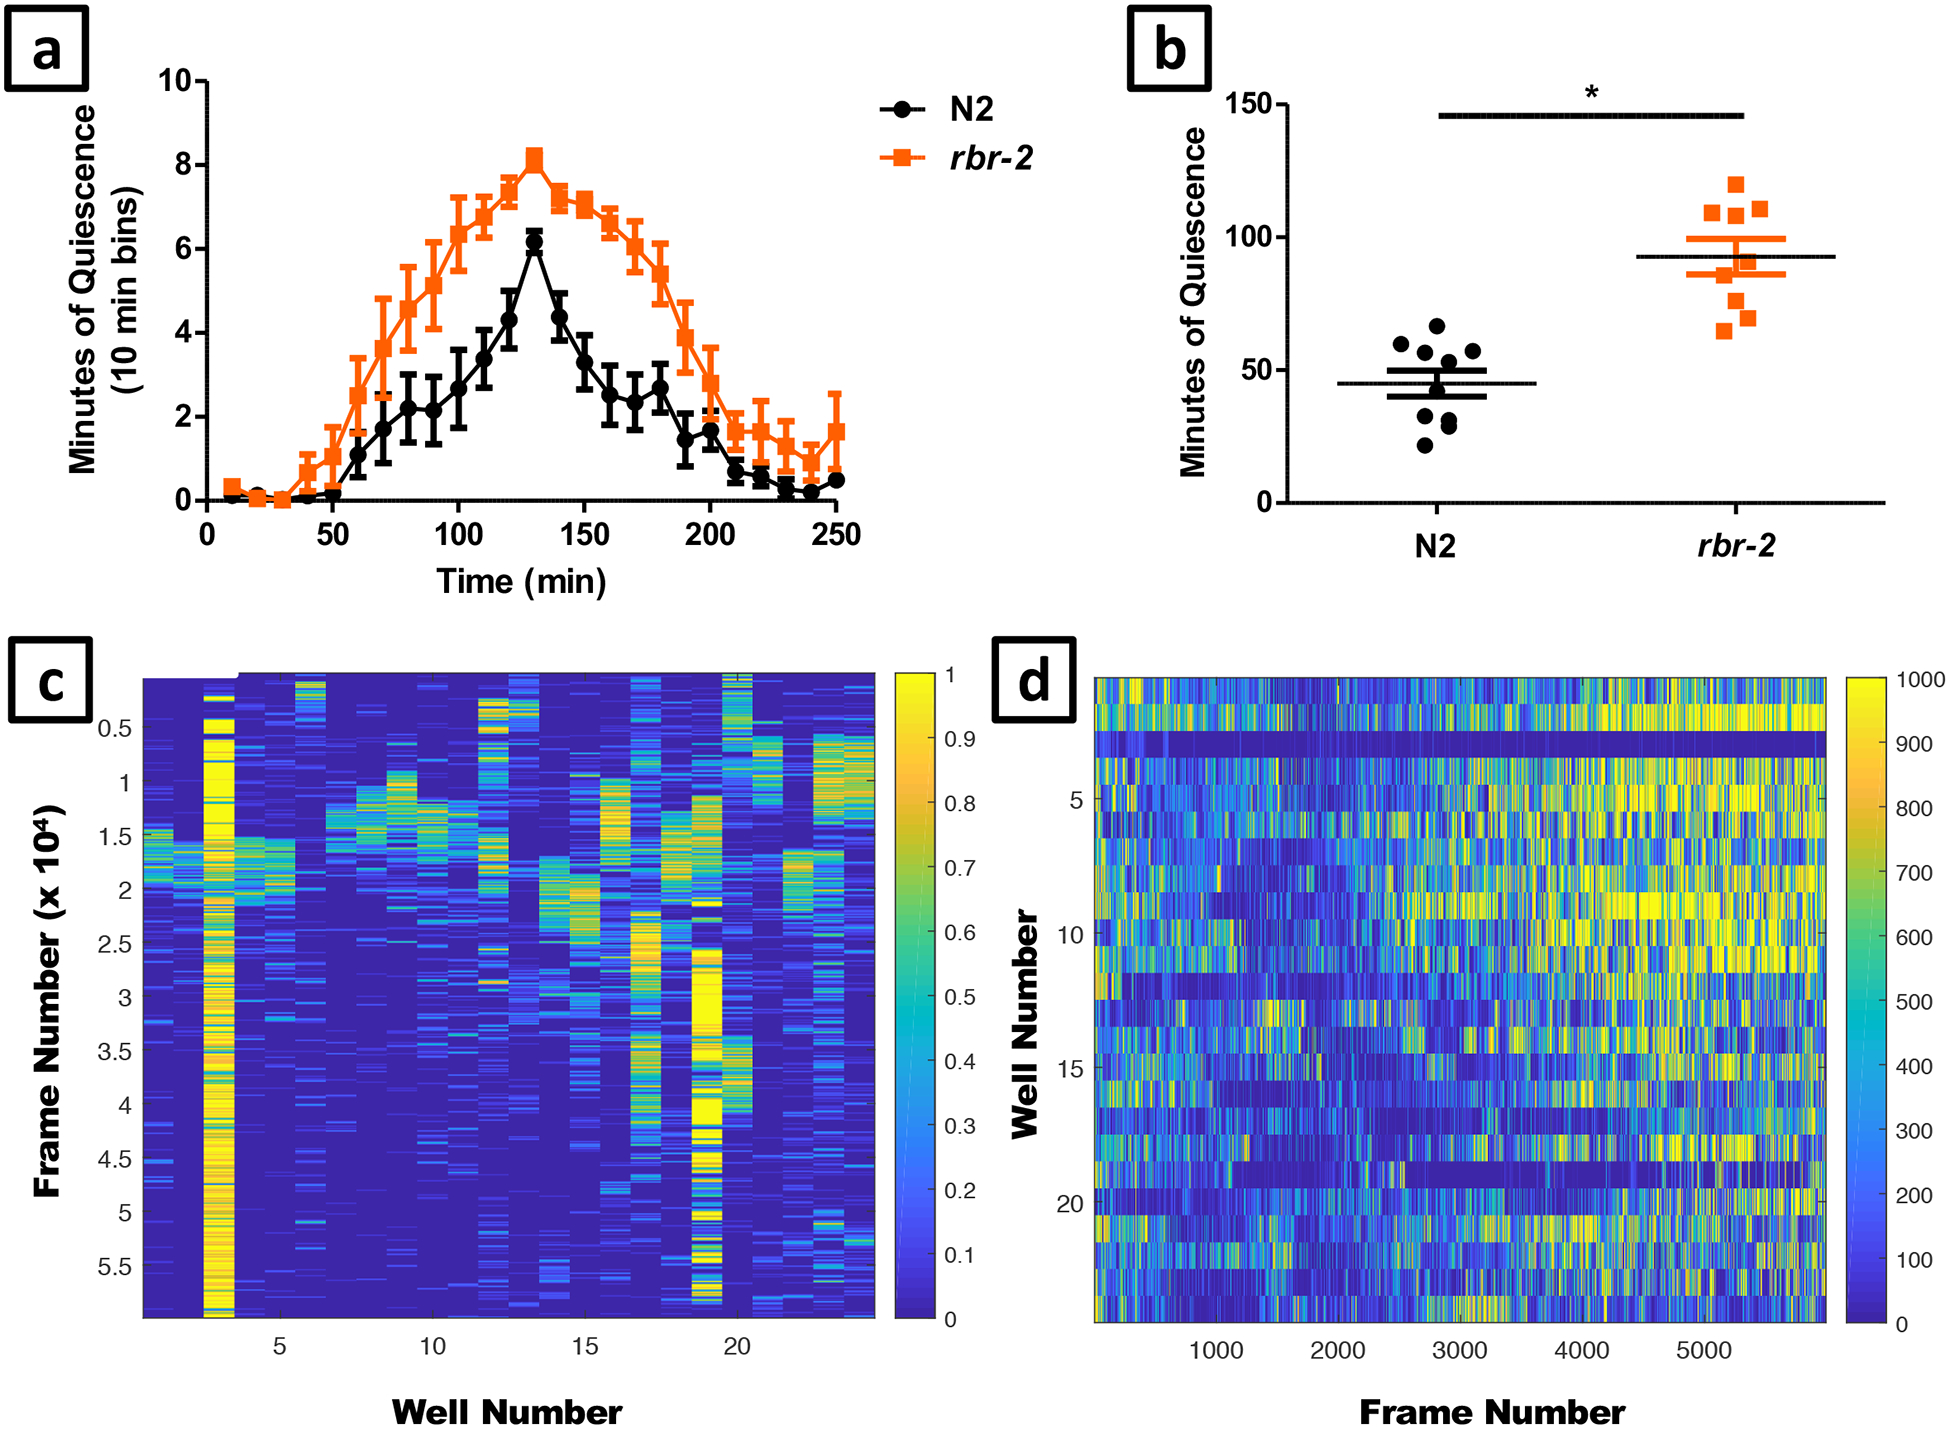
Figure 12. Sample data: DTS with wildtype and rbr-2.

Developmentally timed sleep data obtained from the WorMotel analysis. In this experiment we compared an allele of rbr-2 (tm1231) to wildtype N2 controls. (a) Average number of minutes of quiescence in 10 minute increments during a four-hour period surrounding the peak of lethargus quiescence. N2 n = 10 rbr-2 n = 9. (b) Total number of minutes spent in lethargus for each individual worm. The rbr-2 mutants spent significantly longer in lethargus than N2 (unpaired t-test, p < 0.0001). (c) Quiescence heat map over the course of 16 hours (yellow = quiescence) where time=0 is at the top and time=16 hours is at the bottom of the figure. Columns 1–12 include N2 quiescence data, columns 13–24 include rbr-2 quiescence data. The following wells were censored from the data presented: 3, 6, 13, 19, and 21.The heat map is useful for identifying the time of peak of quiescence (e.g. frames 15000–20000 form worms analyzed in columns 1–2), as well as worms that are injured (e.g. worm analyzed in columns 3 and 19). Quiescence is binned in 10 minute increments. (d) Activity heat map of the same images over the course of 16 hours (yellow = activity), where time=0 is at the left and time=16 hours is at the right of the image. Activity is binned in 10 minute increments.
