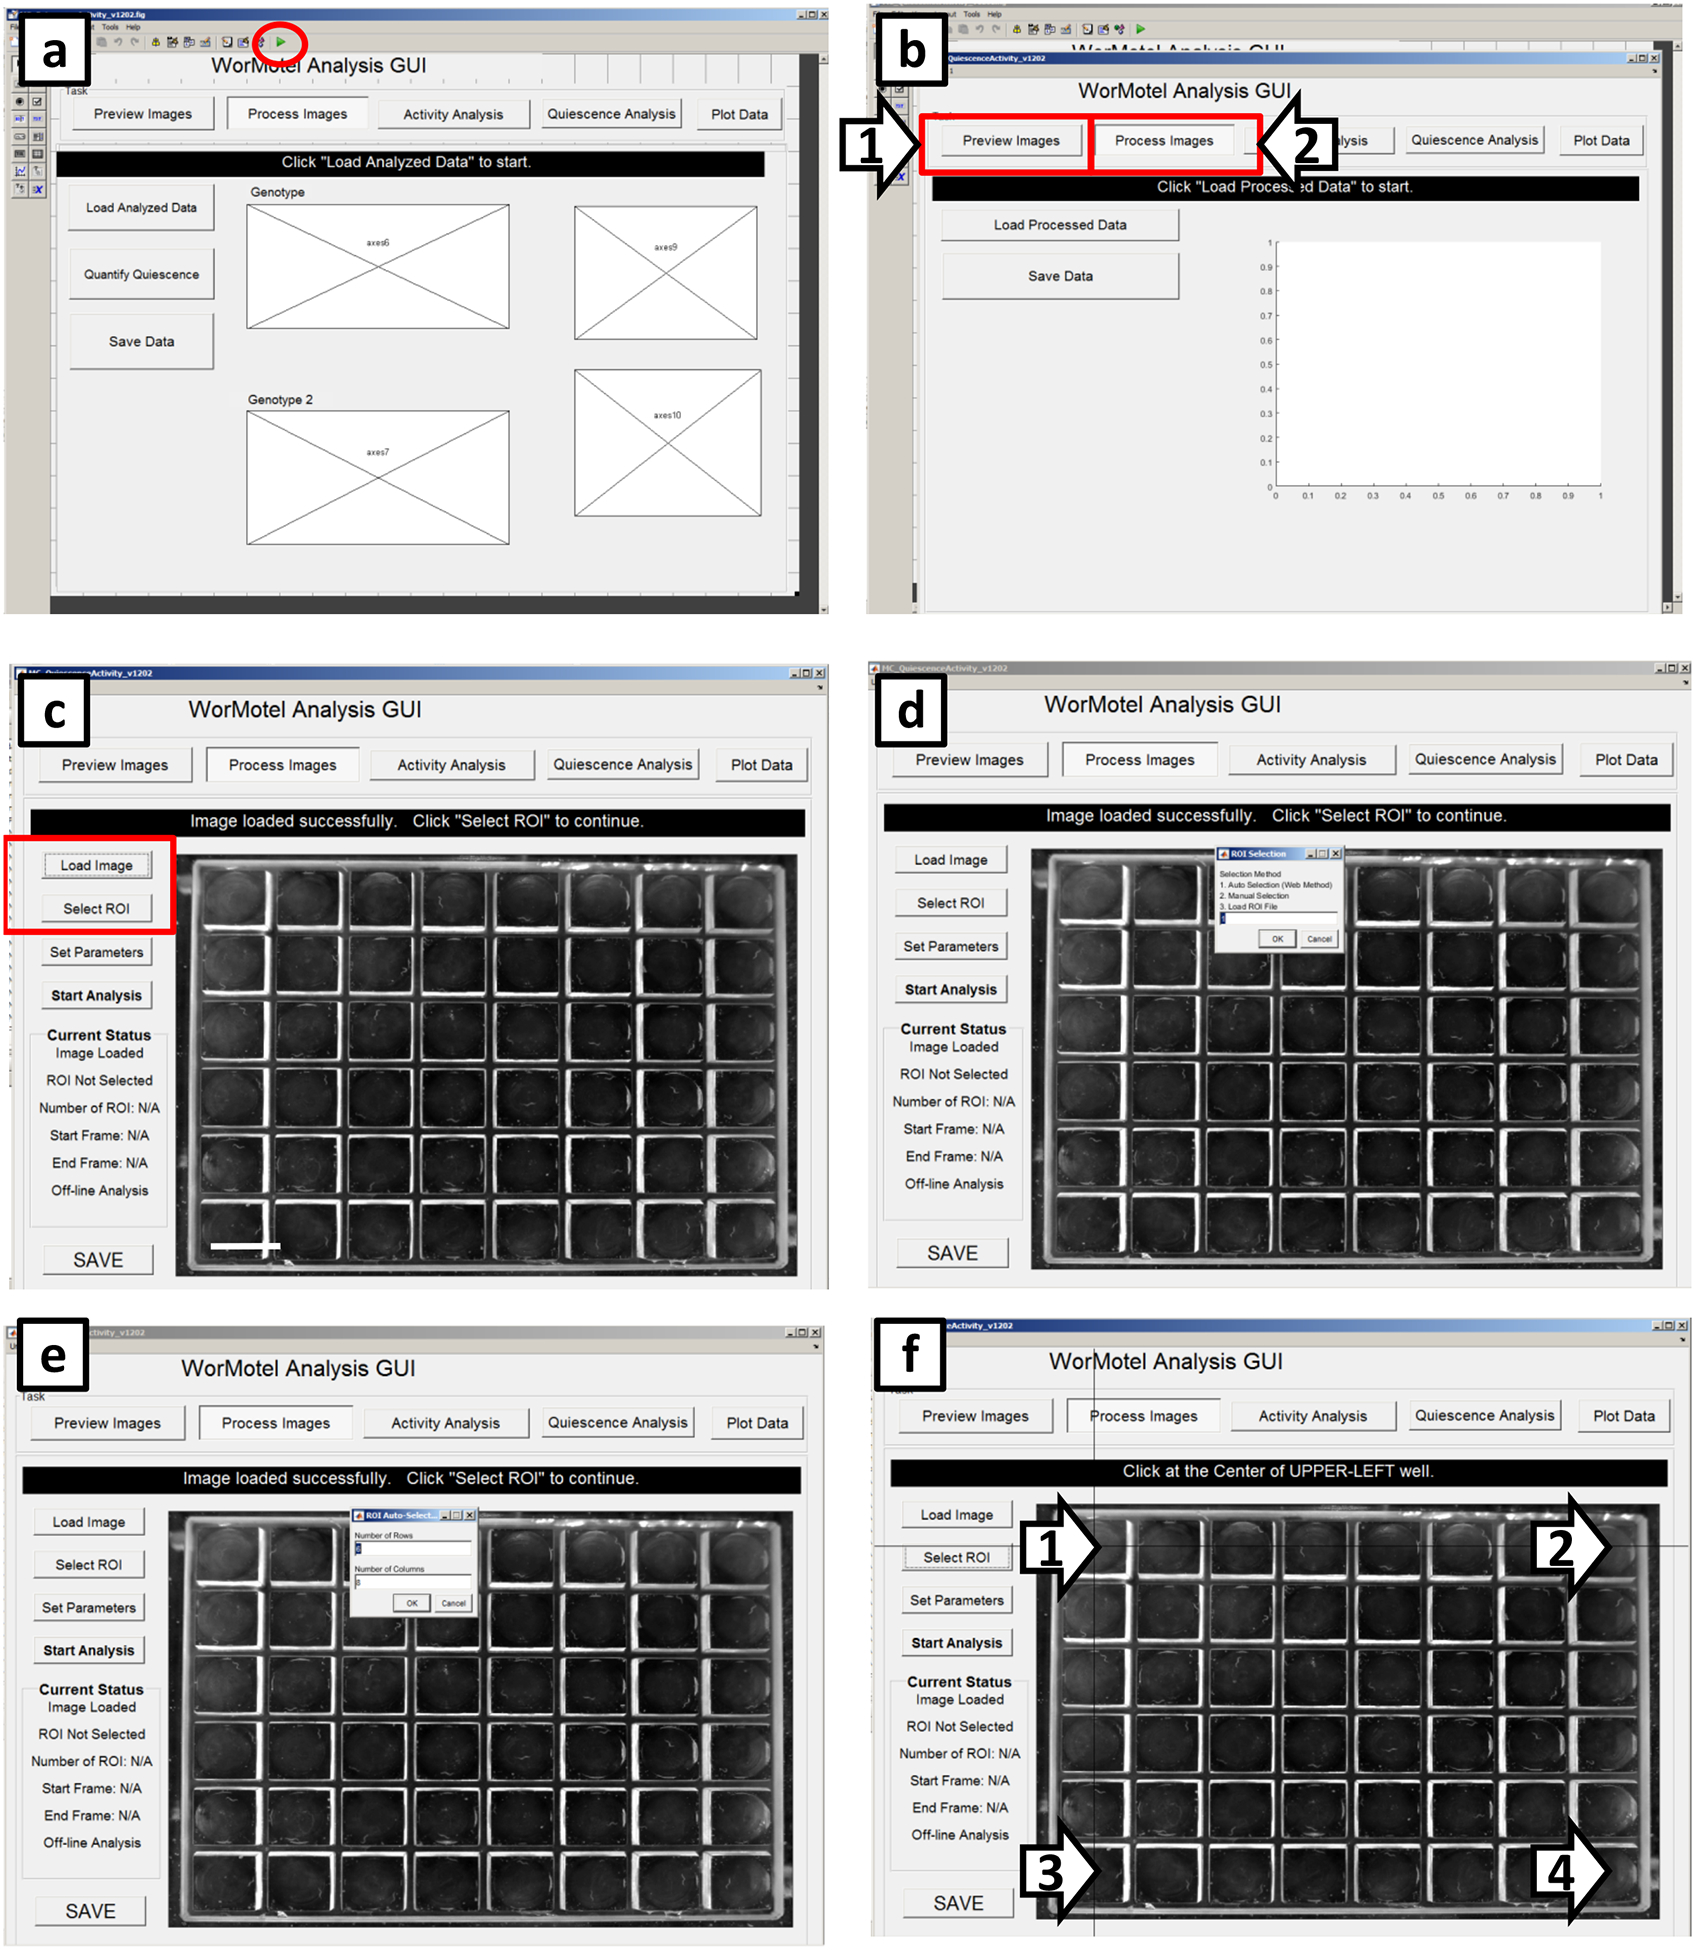
Figure 8. Screenshots of image processing (WorMotel, part 1).

(a) Screen that appears when the GUI has been selected but not initiated. To run the GUI, click the icon within the red circle. (b) To load an image for analysis, first click “Preview Images” (arrow 1) then click back to “Process Images” (arrow 2). (c) To load an image, click “Load Image”. After loading define the regions of interest (ROIs) by clicking on “Select ROI”. (d) To continue ROI selection, type “1” then click “OK”. (e) Define the number of rows and columns to be analyzed. (f) Define the ROIs by clicking on wells in each corner of the imaging range as demarcated by black targets (arrows).
