Figure 4.
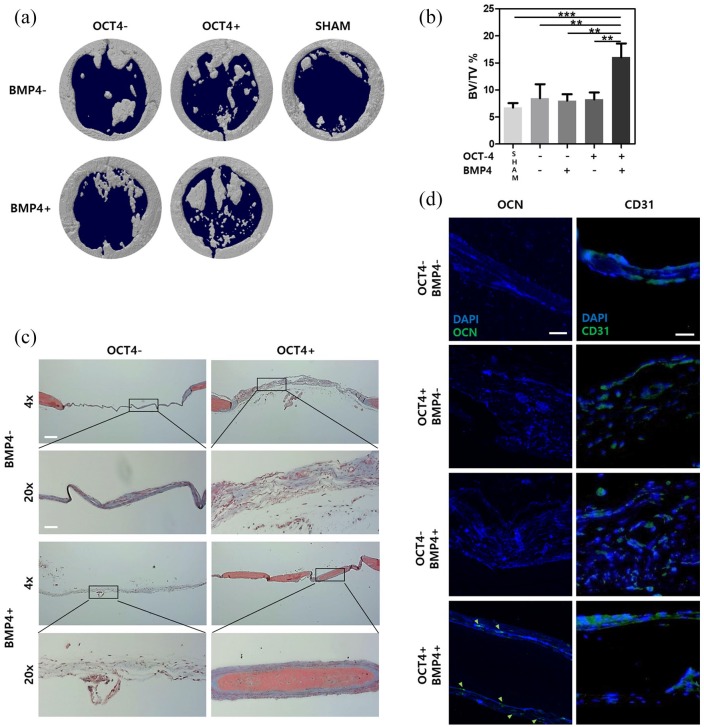
Sequential treatment of OCT-4 and BMP4 enhances in vivo osteogenic differentiation. (a) Micro-CT images show co-treated cells induce high bone regeneration. (b) Quantification of micro-CT bone regeneration volume. (c) MTC staining images represent defect area 8 weeks after scaffold delivery. (d) Immunohistochemistry staining images show OCN and CD31 presence in defect area 8 weeks after scaffold delivery. Green arrows indicate presence of human-specific OCN. HUVECs treated or not treated with either OCT-4 or BMP4 are represented with − or + sign.
Error bars show standard deviation on the mean for n = 3: *p < 0.05; **p < 0.01; ***p < 0.001. MTC staining 4×, 20× scale bar = 200 μm, 50 μm, respectively. IHC scale bar = 20 μm.

