
Figure 1. 8kb-DMP1-Cre selectively ablated YAP/TAZ expression from osteocytes.
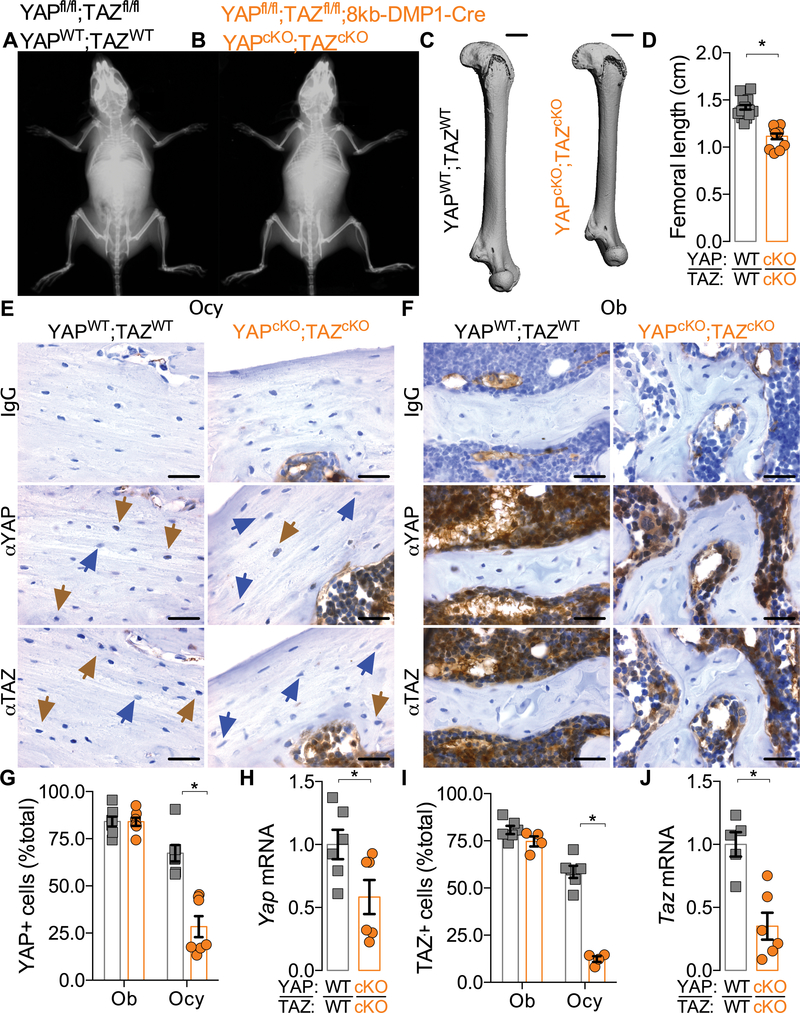
A) Representative radiographs for P84 wild type (YAPWT;TAZWT) and B) conditional double knockout (YAPcKO;TAZcKO) mice. C) P84 femur microCT reconstructions and D) quantification of femoral lengths. E-J) Recombination efficiency and specificity was assessed by measurement of YAP and TAZ protein and mRNA expression. E) Representative micrographs of osteocyte (Ocy) immunostaining for IgG control, YAP, and TAZ in YAPWT;TAZWT and YAPcKO;TAZcKO femurs at P28. F) Representative micrographs of osteoblast (Ob) immunostaining for IgG control, YAP, and TAZ in YAPWT;TAZWT and YAPcKO;TAZcKO femurs at P28. G) YAP protein expression in osteocytes (Ocy) and osteoblasts (Ob) from femoral sections at P28. H) Yap mRNA expression, relative to 18S rRNA, from femoral bone preparations at P84. I) TAZ protein expression in osteocytes (Ocy) and osteoblasts (Ob) from femoral sections at P28. J) Taz mRNA expression, relative to 18S rRNA, from femoral bone preparations at P84. Data are presented with individual samples in scatterplots and bars corresponding to the mean and standard error of the mean (SEM). N = 5–6 per group for qPCR and N = 4–6 per group for IHC. Brown arrows indicate positive osteocytes. Blue arrows indicate negative osteocytes. Scale bars equal 1 mm in microCT reconstructions and 30 μm in all images.