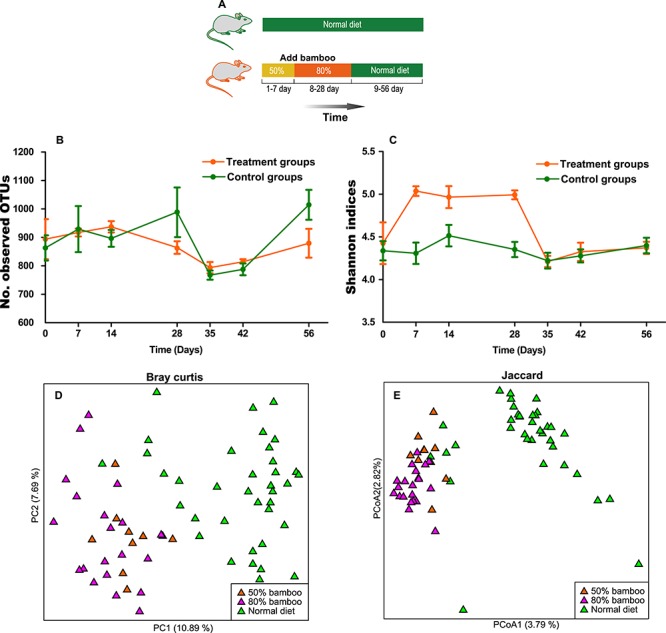
Figure 6.

Alpha and beta diversity of the gut microbiota of mice. (A) Schematic diagram of the mice experiment. (B) Dynamic curve of the Observed OTUs in gut microbiota of the experimental and control groups. (C) The Shannon indices dynamic curve of gut microbiota in the experimental group and control group. PCoA based on (D) Bray Curtis and (E) Jaccard distance.
