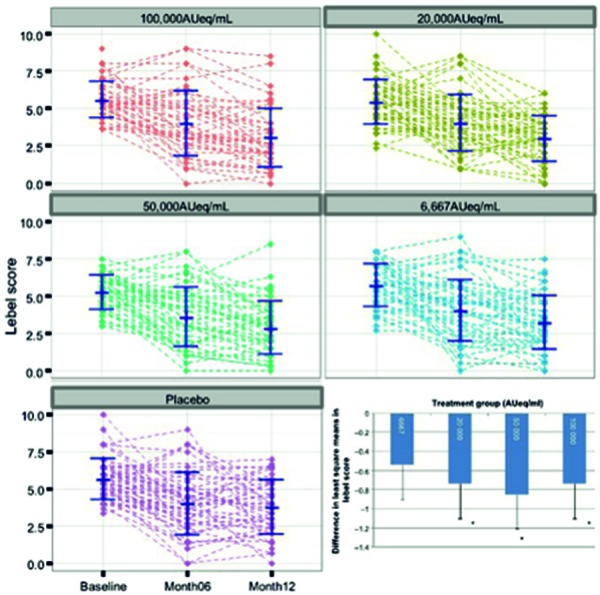
Figure 3. Individual results of a dose finding study using a house dust mite allergoid for SCIT (Pfaar O et al. Allergy 2016; 71(7): 967-76; cf. corresponding online data) [8]. Individual data (course in the “Lebel symptom score” after nasal provocation, y-axes) of all subjects, grouped according to SCIT dose or placebo (displayed above the graphs) before start (baseline), after 6 and 12 months (cf. x-axis on the bottom left). Bottom right: Presentation (same data set) of the group mean values compared to placebo (= 0) after 12 months of SCIT.

