
Figure 4.
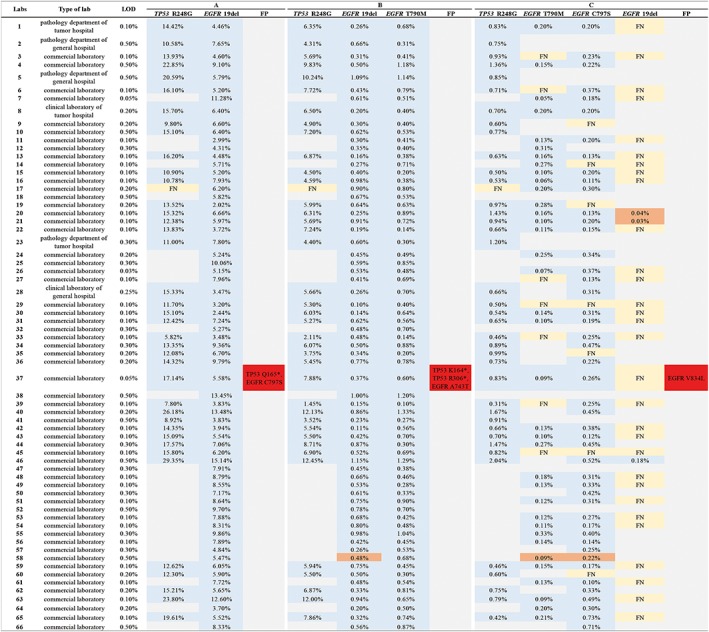
Overview of the performance for qualitative detection. The testing results of each laboratory are indicated by columns. A blue box indicates that the intended variants were correctly reported; a gray box indicates that the intended variants were not reported as the expected variant beyond the specific detectable range or lower than the validated limit of detection (LOD); a yellow box stand for a false‐negative result; a red box stand for a false‐positive result; an orange box stand for the result lower than LOD. The allele frequencies reported are shown inside the boxes.