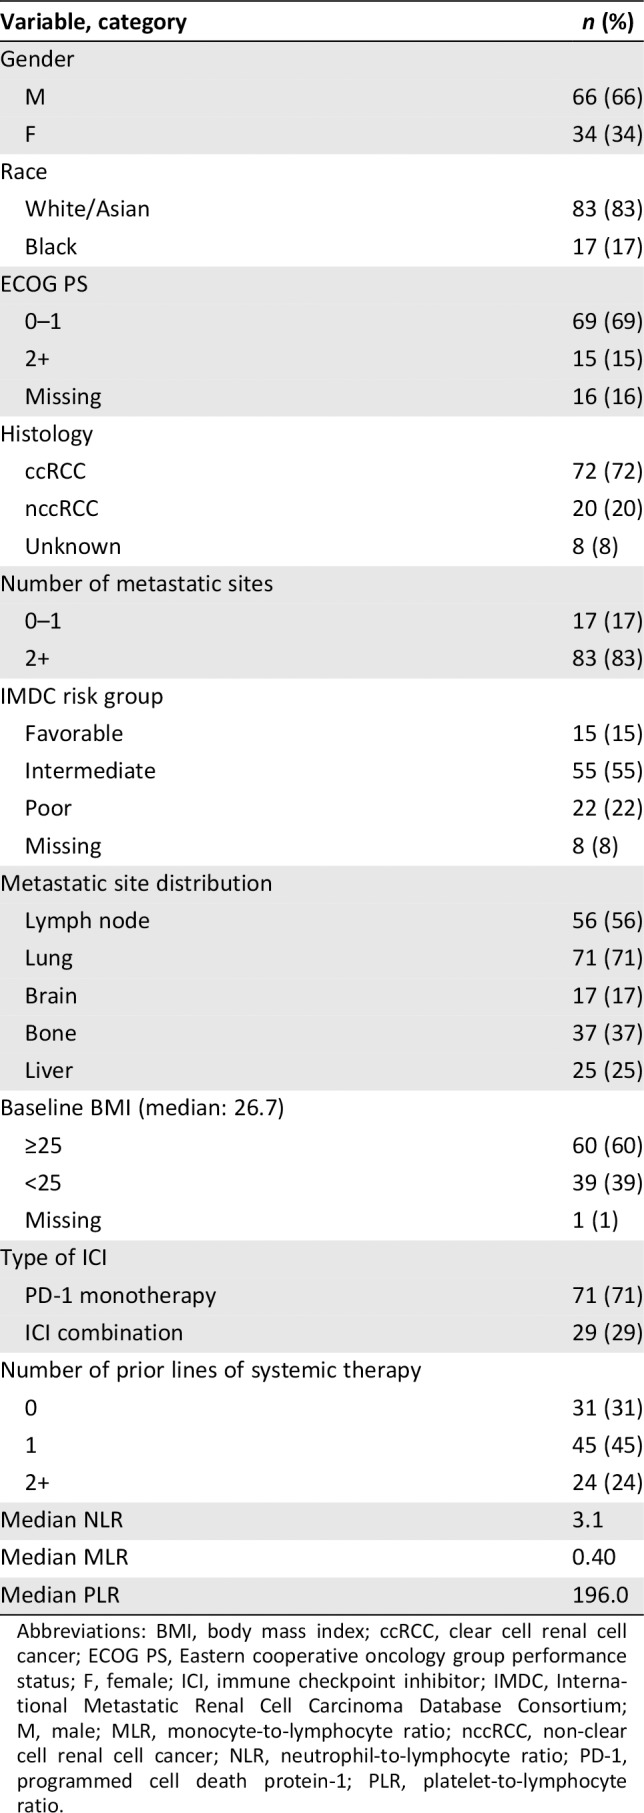
Table 2.
Demographics and baseline patient characteristics
| Variable, category | n (%) |
|---|---|
| Gender | |
| M | 66 (66) |
| F | 34 (34) |
| Race | |
| White/Asian | 83 (83) |
| Black | 17 (17) |
| ECOG PS | |
| 0–1 | 69 (69) |
| 2+ | 15 (15) |
| Missing | 16 (16) |
| Histology | |
| ccRCC | 72 (72) |
| nccRCC | 20 (20) |
| Unknown | 8 (8) |
| Number of metastatic sites | |
| 0–1 | 17 (17) |
| 2+ | 83 (83) |
| IMDC risk group | |
| Favorable | 15 (15) |
| Intermediate | 55 (55) |
| Poor | 22 (22) |
| Missing | 8 (8) |
| Metastatic site distribution | |
| Lymph node | 56 (56) |
| Lung | 71 (71) |
| Brain | 17 (17) |
| Bone | 37 (37) |
| Liver | 25 (25) |
| Baseline BMI (median: 26.7) | |
| ≥25 | 60 (60) |
| <25 | 39 (39) |
| Missing | 1 (1) |
| Type of ICI | |
| PD‐1 monotherapy | 71 (71) |
| ICI combination | 29 (29) |
| Number of prior lines of systemic therapy | |
| 0 | 31 (31) |
| 1 | 45 (45) |
| 2+ | 24 (24) |
| Median NLR | 3.1 |
| Median MLR | 0.40 |
| Median PLR | 196.0 |

Abbreviations: BMI, body mass index; ccRCC, clear cell renal cell cancer; ECOG PS, Eastern cooperative oncology group performance status; F, female; ICI, immune checkpoint inhibitor; IMDC, International Metastatic Renal Cell Carcinoma Database Consortium; M, male; MLR, monocyte‐to‐lymphocyte ratio; nccRCC, non‐clear cell renal cell cancer; NLR, neutrophil‐to‐lymphocyte ratio; PD‐1, programmed cell death protein‐1; PLR, platelet‐to‐lymphocyte ratio.
