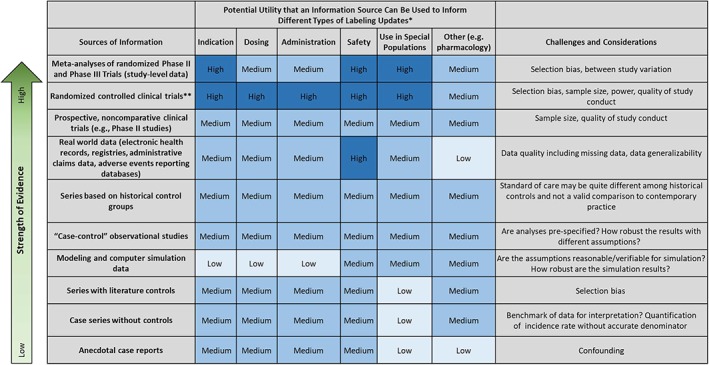
Figure 2.

Potential utility of an information source to inform different types of labeling updates*High utility = dark blue; medium utility = blue; low utility = light blue. This table represents a general schematic. Although utility has been visualized as three distinct categories, there can be substantial variability within each category. Further work could refine the utility of different information sources by using a Likert scale. In addition, the quality of the sources of information can vary widely, which could affect assessment of the strength of evidence. **Randomized controlled clinical trials include phase III and some phase II studies. Hierarchy of Strength of Evidence draws on the conceptual framing from Green SB, Byar DP. Using observational data from registries to compare data: The fallacy of omnimetrics. Stat Med 1984;3:361–373 27.
