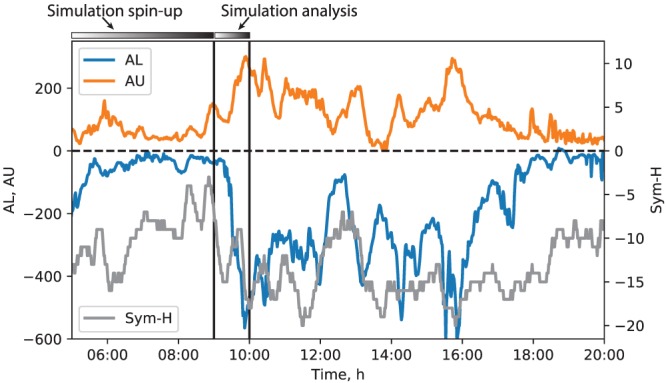
Figure 1.

Overview of the geomagnetic indices on 9 August 2016 between 05:00 and 20:00 UT from the National Aeronautics and Space Administration OMNI database. The horizontal bars at the top, along with the vertical lines placed at 09:00 and 10:00 UT, indicate the duration of the simulation presented below (see also Figure 2). The simulation covered the 05:00–10:00 UT interval, where the 09:00–10:00 UT 1‐hr interval was used for analysis and the rest for preconditioning. The figure indicates that the 09:00–10:00 UT interval covered partly the growth phase, the entire expansion phase, and the beginning of the recovery phase of the simulated substorm. The rest of the 05:00–20:00 UT interval is shown to demonstrate the overall geomagnetic activity context on that day.
