
Figure 3.
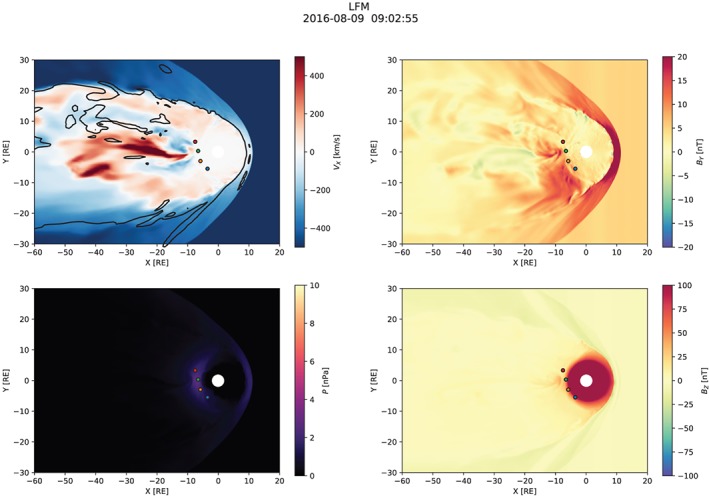
Overview of the simulation ∼20 min before the substorm onset. The solar magnetic equatorial plane is shown in each panel. Magnetospheric spacecraft are marked with blue (GOES‐13), orange (GOES‐14), green (GOES‐15), and red (MMS‐1) circles which indicate the spacecraft positions projected to the plane. The black contour in the upper left panel indicates the B z=0 isocontour. LFM = Lyon‐Fedder‐Mobarry.