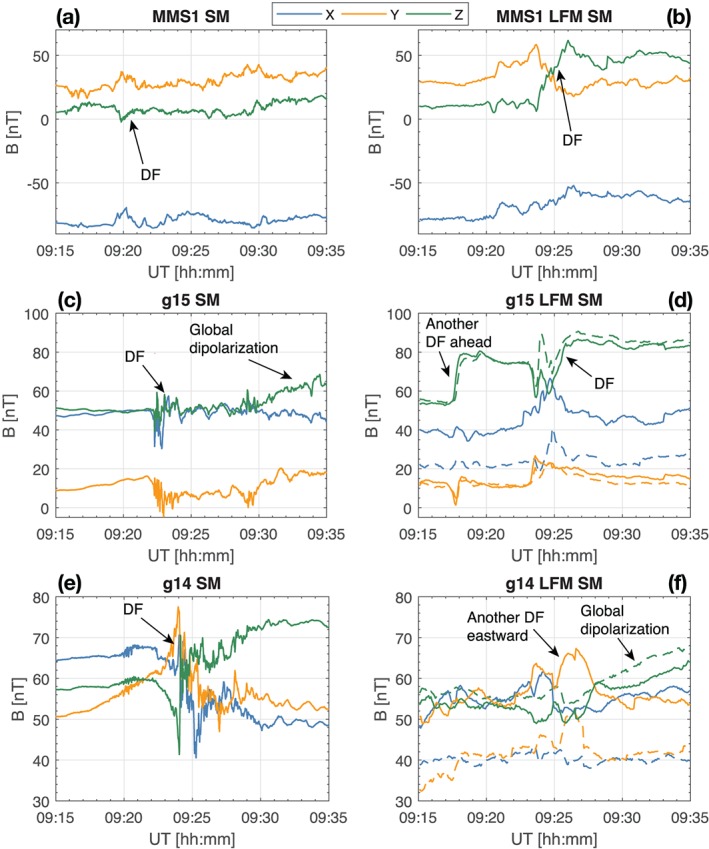
Figure 11.

(left column) MMS‐1 (a), GOES‐15 (c), and GOES‐14 (e) SM magnetic field components on 9 August 2016 for the time period indicated on the horizontal axis. (right column) The same magnetic field components obtained from the simulation. The virtual MMS‐1 data are plotted along the actual spacecraft trajectory as are the GOES‐14 and GOES‐15 data indicated by the dashed lines in panels (d) and (f). The solid lines in the GOES‐14 and GOES‐15 panels are plotted along the virtual spacecraft trajectory raised by Δz=0.4 R E in the SM z direction. DF = dipolarization front; LFM = Lyon‐Fedder‐Mobarry; SM = solar magnetic.
