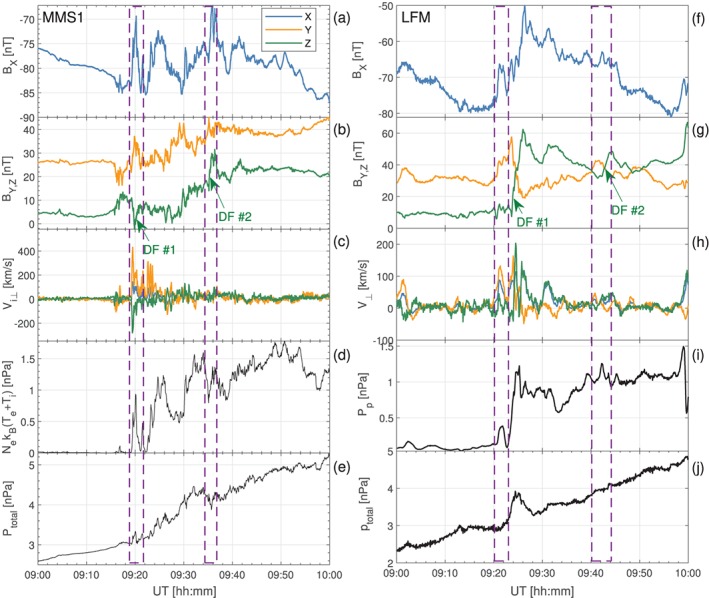
Figure 14.

(left column) MMS‐1 data on 9 August 2016 between 09:00 and 10:00 UT. Shown at survey cadence are as follows: Bx (a) and By, Bz (b) solar magnetic magnetic field components; three solar magnetic components of the perpendicular ion velocity with positive V ⊥,x values towards Earth (c); sum of the electron and ion thermal pressures (d); and sum of the magnetic pressure and the thermal particle pressure (e). (right column) The corresponding virtual MMS‐1 data sampled along the spacecraft trajectory through the simulation (f–j). DF = dipolarization front; LFM = Lyon‐Fedder‐Mobarry.
