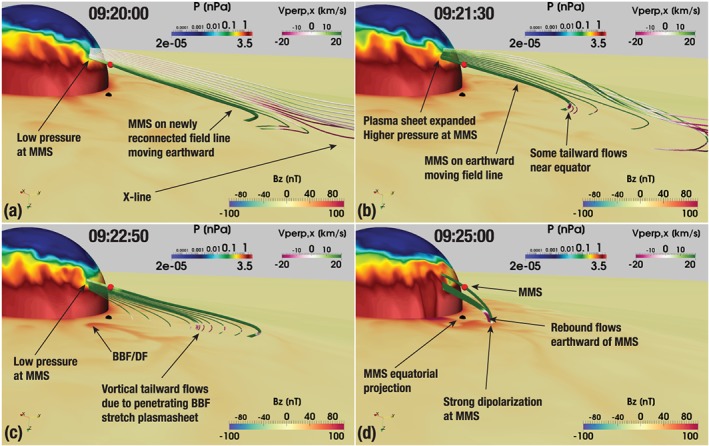
Figure 15.

A 3‐D view of the simulated magnetosphere at the beginning (a), in the middle (b), and at the end (c) of the time period marked with the first magenta rectangle in Figure 14. (d) The same view at the later time when MMS‐1 observes the strong dipolarization. The view is from a vantage point southward of the magnetic equator in the morning sector. The axis widget in the lower left corner helps to orient the reader; in particular, it indicates the solar magnetic z axis pointing down. The MMS‐1 location is marked with the red spherical glyph as in the previous figures. Its equatorial projection is marked with the black spherical glyph. The equatorial plane is color coded with the solar magnetic B z magnetic field component and the spherical slice through the simulation at 6.4 R E radial distance with the plasma pressure. All panels show a thick magnetic field line anchored at the MMS‐1 location. Panels (a) and (b) trace additional field lines (with reduced thickness) from a line of seed points placed southward of MMS‐1. Similarly, panels (c) and (d) trace additional magnetic field lines (also with reduced thickness) from seed points equatorward of MMS‐1. All field lines in all panels are color coded with V ⊥,x. The corresponding color bars are shown in all panels. BBF = bursty bulk flow; DF = dipolarization front; MMS = Magnetospheric Multiscale.
