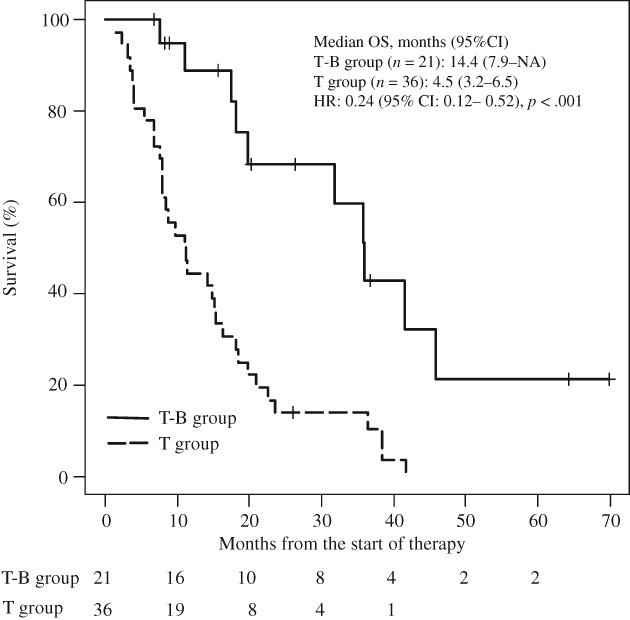
Figure 2.

Kaplan‐Meier curves for comparison of overall survival between patients with metastatic colorectal cancer in the T‐B group and the T group. Abbreviations: CI, confidence interval; HR, hazard ratio; NA, not applicable because calculation was impossible; OS, overall survival; T group, patients receiving TAS‐102 monotherapy; T‐B group, patients receiving TAS‐102 plus bevacizumab.
