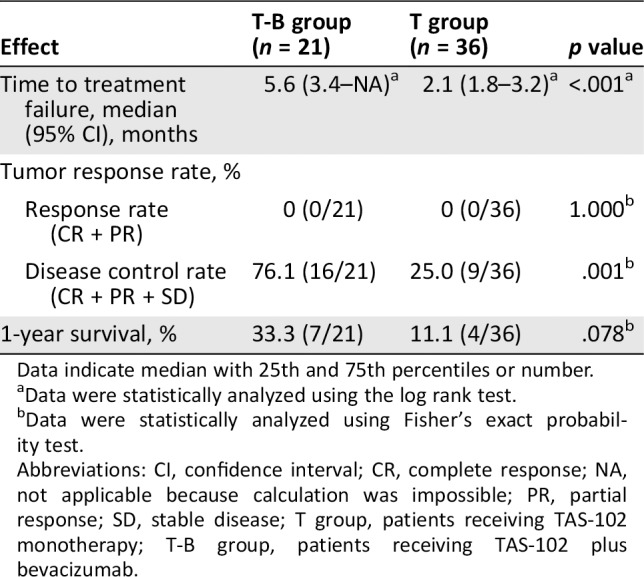
Table 3.
Comparison of the median time to treatment failure and disease control rate between patients with metastatic colorectal cancer in the T‐B group and the T group
| Effect | T‐B group (n = 21) | T group (n = 36) | p value |
|---|---|---|---|
| Time to treatment failure, median (95% CI), months | 5.6 (3.4–NA)a | 2.1 (1.8–3.2)a | <.001a |
| Tumor response rate, % | |||
| Response rate (CR + PR) | 0 (0/21) | 0 (0/36) | 1.000b |
| Disease control rate (CR + PR + SD) | 76.1 (16/21) | 25.0 (9/36) | .001b |
| 1‐year survival, % | 33.3 (7/21) | 11.1 (4/36) | .078b |

Data indicate median with 25th and 75th percentiles or number.
Data were statistically analyzed using the log rank test.
Data were statistically analyzed using Fisher's exact probability test.
Abbreviations: CI, confidence interval; CR, complete response; NA, not applicable because calculation was impossible; PR, partial response; SD, stable disease; T group, patients receiving TAS‐102 monotherapy; T‐B group, patients receiving TAS‐102 plus bevacizumab.
