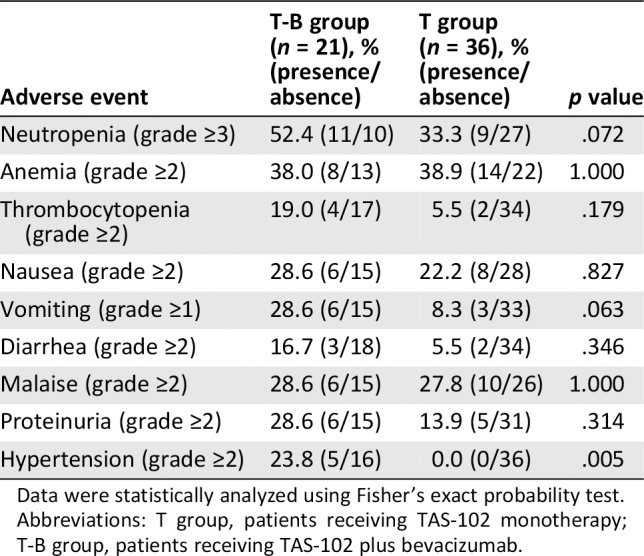
Table 4.
Comparison of the incidence of adverse events between patients with metastatic colorectal cancer in the T‐B group and the T group
| Adverse event | T‐B group (n = 21), % (presence/absence) | T group (n = 36), % (presence/absence) | p value |
|---|---|---|---|
| Neutropenia (grade ≥3) | 52.4 (11/10) | 33.3 (9/27) | .072 |
| Anemia (grade ≥2) | 38.0 (8/13) | 38.9 (14/22) | 1.000 |
| Thrombocytopenia (grade ≥2) | 19.0 (4/17) | 5.5 (2/34) | .179 |
| Nausea (grade ≥2) | 28.6 (6/15) | 22.2 (8/28) | .827 |
| Vomiting (grade ≥1) | 28.6 (6/15) | 8.3 (3/33) | .063 |
| Diarrhea (grade ≥2) | 16.7 (3/18) | 5.5 (2/34) | .346 |
| Malaise (grade ≥2) | 28.6 (6/15) | 27.8 (10/26) | 1.000 |
| Proteinuria (grade ≥2) | 28.6 (6/15) | 13.9 (5/31) | .314 |
| Hypertension (grade ≥2) | 23.8 (5/16) | 0.0 (0/36) | .005 |

Data were statistically analyzed using Fisher's exact probability test.
Abbreviations: T group, patients receiving TAS‐102 monotherapy; T‐B group, patients receiving TAS‐102 plus bevacizumab.
