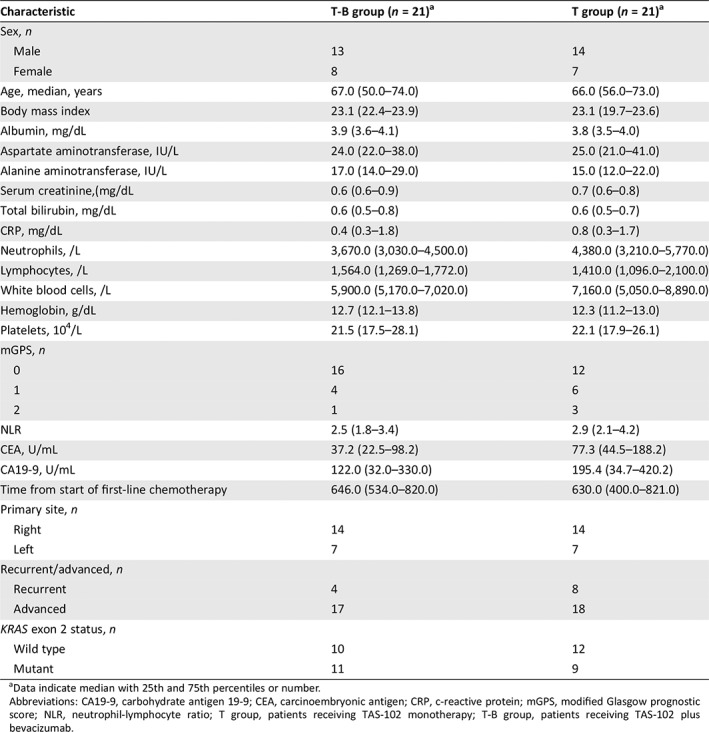
Table 5.
Patient demographics and baseline characteristics among patients in the T‐B group and the T group after propensity score matched analysis
| Characteristic | T‐B group (n = 21)a | T group (n = 21)a |
|---|---|---|
| Sex, n | ||
| Male | 13 | 14 |
| Female | 8 | 7 |
| Age, median, years | 67.0 (50.0–74.0) | 66.0 (56.0–73.0) |
| Body mass index | 23.1 (22.4–23.9) | 23.1 (19.7–23.6) |
| Albumin, mg/dL | 3.9 (3.6–4.1) | 3.8 (3.5–4.0) |
| Aspartate aminotransferase, IU/L | 24.0 (22.0–38.0) | 25.0 (21.0–41.0) |
| Alanine aminotransferase, IU/L | 17.0 (14.0–29.0) | 15.0 (12.0–22.0) |
| Serum creatinine,(mg/dL | 0.6 (0.6–0.9) | 0.7 (0.6–0.8) |
| Total bilirubin, mg/dL | 0.6 (0.5–0.8) | 0.6 (0.5–0.7) |
| CRP, mg/dL | 0.4 (0.3–1.8) | 0.8 (0.3–1.7) |
| Neutrophils, /L | 3,670.0 (3,030.0–4,500.0) | 4,380.0 (3,210.0–5,770.0) |
| Lymphocytes, /L | 1,564.0 (1,269.0–1,772.0) | 1,410.0 (1,096.0–2,100.0) |
| White blood cells, /L | 5,900.0 (5,170.0–7,020.0) | 7,160.0 (5,050.0–8,890.0) |
| Hemoglobin, g/dL | 12.7 (12.1–13.8) | 12.3 (11.2–13.0) |
| Platelets, 104/L | 21.5 (17.5–28.1) | 22.1 (17.9–26.1) |
| mGPS, n | ||
| 0 | 16 | 12 |
| 1 | 4 | 6 |
| 2 | 1 | 3 |
| NLR | 2.5 (1.8–3.4) | 2.9 (2.1–4.2) |
| CEA, U/mL | 37.2 (22.5–98.2) | 77.3 (44.5–188.2) |
| CA19‐9, U/mL | 122.0 (32.0–330.0) | 195.4 (34.7–420.2) |
| Time from start of first‐line chemotherapy | 646.0 (534.0–820.0) | 630.0 (400.0–821.0) |
| Primary site, n | ||
| Right | 14 | 14 |
| Left | 7 | 7 |
| Recurrent/advanced, n | ||
| Recurrent | 4 | 8 |
| Advanced | 17 | 18 |
| KRAS exon 2 status, n | ||
| Wild type | 10 | 12 |
| Mutant | 11 | 9 |

Data indicate median with 25th and 75th percentiles or number.
Abbreviations: CA19‐9, carbohydrate antigen 19‐9; CEA, carcinoembryonic antigen; CRP, c‐reactive protein; mGPS, modified Glasgow prognostic score; NLR, neutrophil‐lymphocyte ratio; T group, patients receiving TAS‐102 monotherapy; T‐B group, patients receiving TAS‐102 plus bevacizumab.
