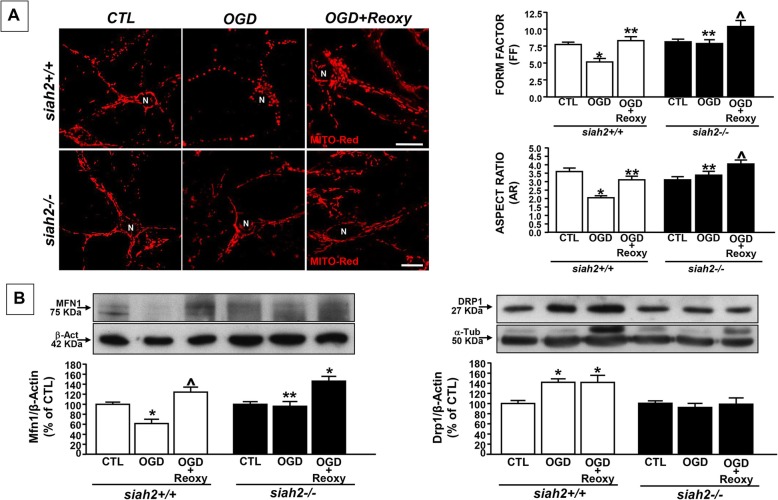
Fig. 1.
Mitochondrial morphology in primary cortical neurons obtained from siah2+/+ and siah2−/− mice exposed to OGD and OGD/Reoxygenation. (a- left) Imaging mitochondrial morphology in siah+/+ and siah−/− cortical neurons by confocal microscopy and MitoTracker Red (20 nM) (left panel). N: neurons, scale bars: 10 μm. (a- right) quantification of the changes in mitochondrial morphology by Image J software. Form factor (FF) and Aspect ratio (AR) in siah+/+ and siah−/− neurons. b Western Blot analysis of Mfn1 and DRP1 protein expression in siah2+/+ and siah2−/−cortical neurons exposed to OGD and OGD/Reoxygenation. Each bar represents the mean + S.E.M. of the percentage of different experimental values obtained in three independent experimental sessions. *P < 0.05 vs siah2+/+ CTL; **P < 0.05 vs siah2+/+ OGD; ^P < 0.05 vs siah2+/+ OGD/Reoxy

