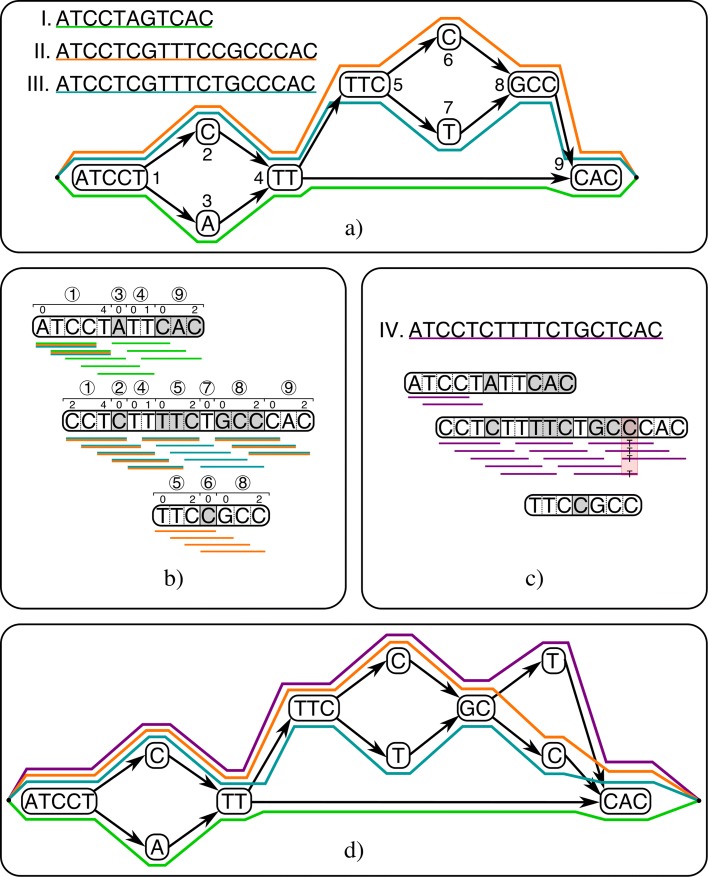
Fig. 1.
Schematic overview of how CHOP aligns reads to a population graph. a As input, CHOP accepts a graphical representation of three distinct haplotypes (I, II, III). Colored paths through the graph identify underlying haplotypes. b CHOP decomposes the graph into a null graph (a graph devoid of edges) for substrings of length 4 (Additional file 1: Figure S1 gives the full details about the decomposition). The obtained null graph contains three nodes, and the sequence that is defined on these nodes covers all substrings of length 4 which occur in the haplotypes encoded in the graph. Annotations above each node refer to intervals within nodes of the input graph. c The reads (with length 4) from a new haplotype (IV) can be aligned to the null graph; consequently, a mismatch can be called from the read pileup. d Through the attached interval definitions that are assigned to the null graph, the novel variant can be positioned on node 8 of the original graph. Incorporating this variant results in a new graph

