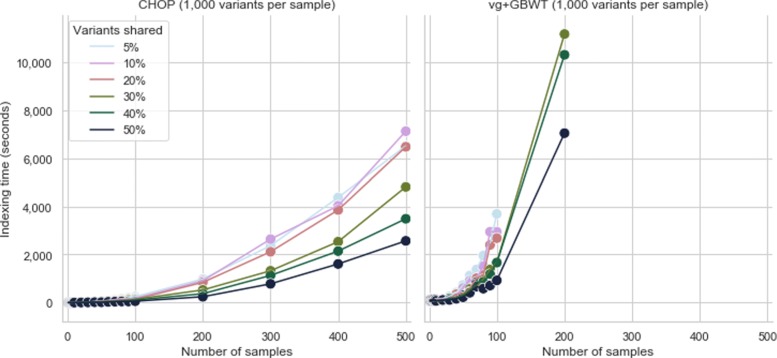
Fig. 3.
CHOP and vg+GBWT indexing time (s) of graphs with increasingly more encoded samples, where each sample contributes 1000 variants to the graphs. The coloring indicates different probabilities of sharing variants within the simulated population. For instance with a probability of 5%, 95% of all sample variation will be unique to that particular sample, while the remainder is shared with 1 or more other samples. Missing points in the plots indicate that the indexing failed by either exceeding 4 h of compute time or peak memory of 80 GB. More details can be found in Additional file 1: Section 17

