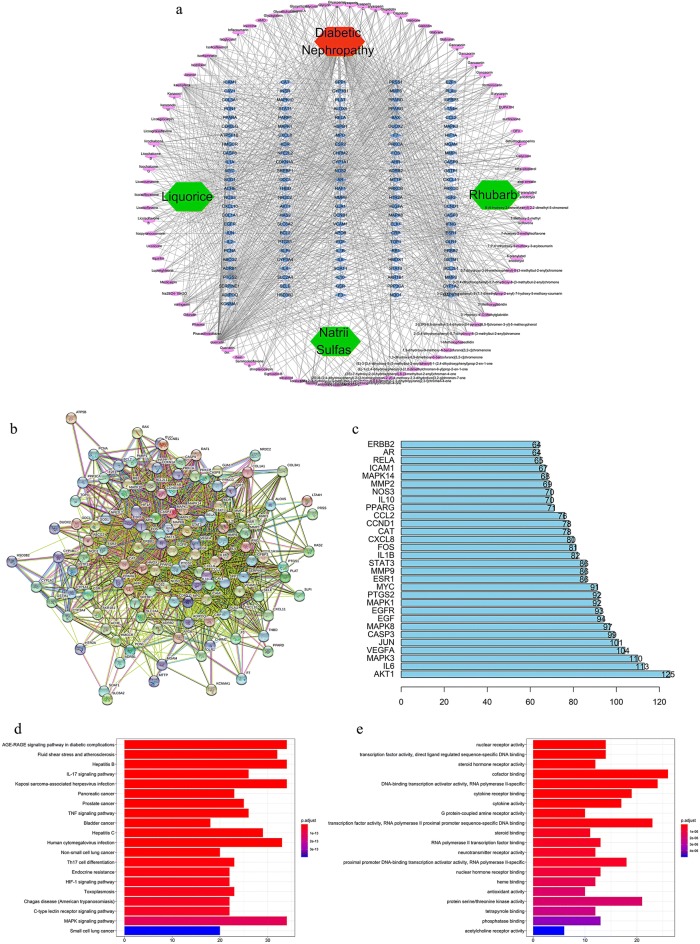
Fig. 5.
Network construction and pathway and functional enrichment analysis of the effect of JSD on DN. a Potential active ingredient-target-disease network. The different colors of the symbols represent the following: disease (red), herb names (green), targets (blue) and compounds (purple). b PPI network. The following nodes are shown: query proteins and direct interactors (colored nodes), secondary interactors (white nodes), proteins with unknown 3D structure (empty nodes), proteins with known or predicted 3D structure (filled nodes) from curated databases ( ), experiments (
 ), gene neighborhood (
 ), gene fusions (
 ), gene cooccurrence (
 ), text mining (
 ), coexpression (
 ), and protein homology (
 ). c Frequency analysis of protein targets. d KEGG pathway enrichment analysis. The gradual change in color represents the change in probability. e GO function analysis. The gradual change in color represents the change in probability

