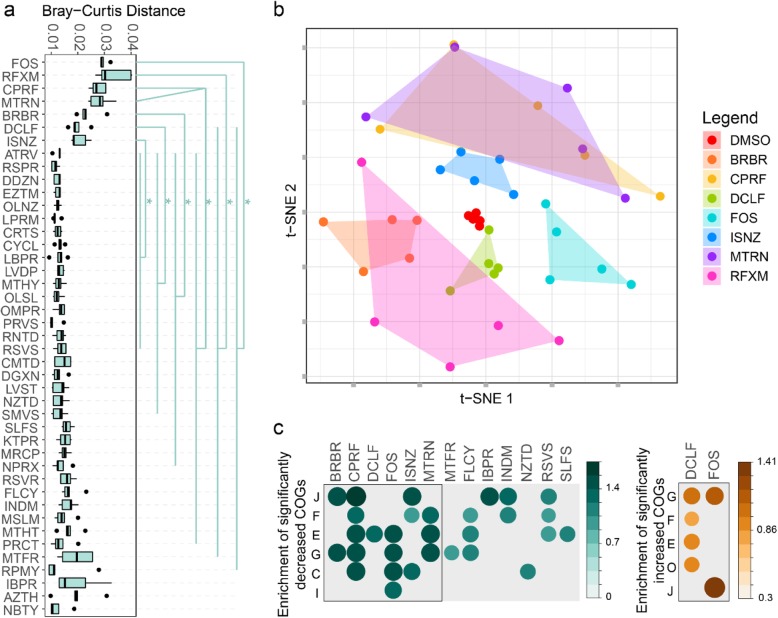
Fig. 3.
Effect of compounds on metaproteomic profiles of the microbiome. a Bray-Curtis distance of protein groups between drug-treated microbiomes and the corresponding DMSO control samples. Statistical significance was calculated by pairwise Wilcoxon test (FDR-adjusted p < 0.05). b Unsupervised dimensionality reduction analysis showing compound-specific patterns of responses to class I compounds. c Enrichment analysis of all significantly different COGs in the POC dataset. Significantly altered COGs with a p value cutoff of 0.05 are shown

