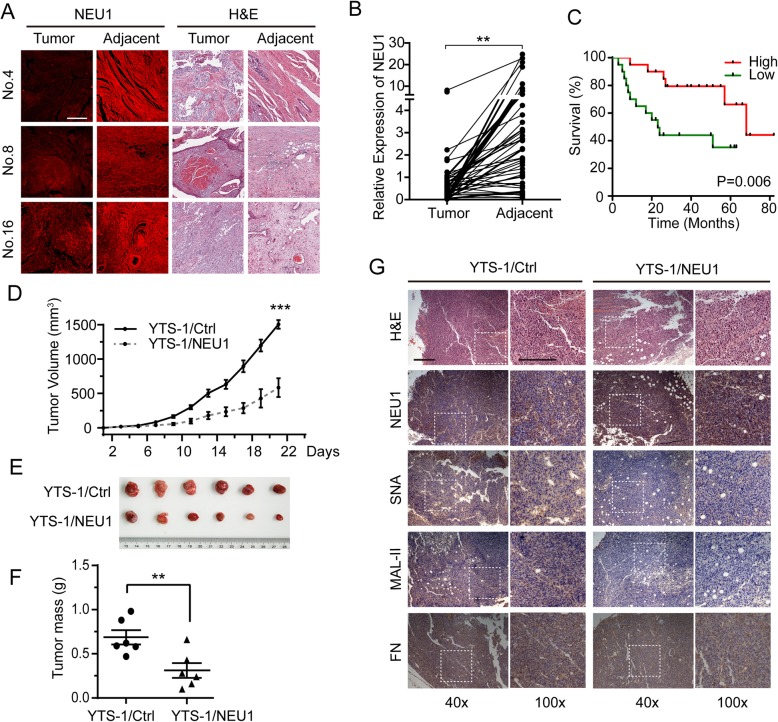
Fig. 6.
NEU1 overexpression suppresses tumor growth in vivo. NEU1 in bladder cancer clinical tissues was evaluated by immunostaining on tissue microarrays (TMAs). Each of the 44 TMA pairs consisted of two dots (one carcinoma tissue, two adjacent noncancerous tissues) from the same patient. Each pair was analyzed by anti-NEU1 antibody staining. a Representative NEU1 expression in carcinoma nest and adjacent noncancerous cells and hematoxylin and eosin (H&E) staining of samples 4, 8, and 16. Scale bar: 50 μm. b TMA scores from carcinoma tissue and matched noncancerous tissue for each pair were analyzed using the Image Pro Plus software program. c Kaplan-Meier overall survival curves for bladder cancer patients classified according to relative NEU1 expression level. TMAs from 55 patients were stained with anti-NEU1 antibody and scanned by GenePix microarray scanner. Patients were classified into “relatively high” (n = 20), “relatively low” (n = 20), and “non-significant” (n = 15) groups based on median NEU1 expression. d Tumor growth curve from BALB/c-nu mice injected with YTS-1/Ctrl or YTS-1/NEU1 cells. e Dissected tumors in nude mice (n = 6) injected with YTS-1/Ctrl or YTS-1/NEU1 cells, after 3 weeks. f Masses of dissected tumors. g Immunohistochemistry of tumor tissue from BALB/c-nu mice. Scale bar: 50 μm. Mean values were compared by paired Student’s t-test. *, P = 0.01–0.05. **, P = 0.001–0.005. ***, P < 0.001

