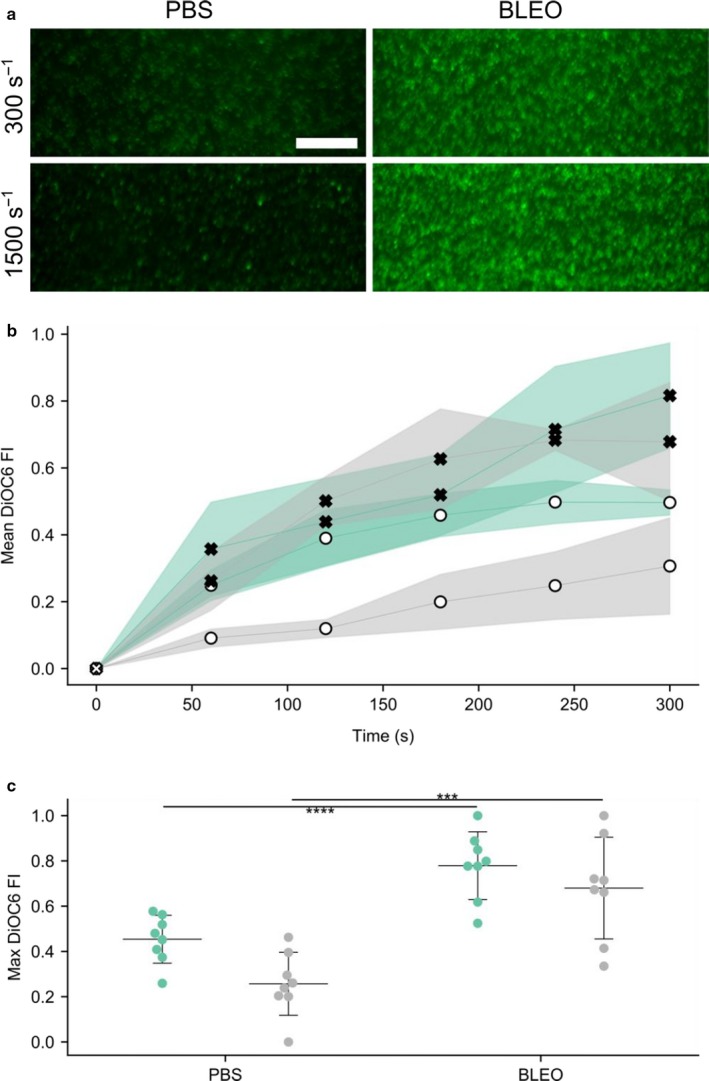
Figure 1.

Platelets from mice with bleomycin‐induced PH demonstrate increased buildup during in vitro flow assays. Assays were run for 5 min at 300 s−1 and 1,500 s−1 to mimic venous and arterial shear rates. (a) Representative images of DiOC6‐labeled mouse platelets (scale bar = 50 µm) (b) Representative time series curves of platelet DiOC6 fluorescence. Green and grey regions depict assay shear rates of 300 s−1 and 1,500 s−1, respectively. Filled x's represent bleomycin‐treated mice, while open circles represent PBS treated mice. (c) Summary statistics of maximum DiOC6 FI for each assay. A single dot represents one assay, middle line shows the mean, and error bars display SD. At a given shear rate, blood from mice with experimental PH show an approximate twofold increase in platelet fluorescence. *** and **** denotes p < 10−3 and p < 10−4, respectively. Four technical replicates were performed on each sample and each condition was repeated twice on separate days, n = 4, PBS (1M, 1F), Bleo (1M, 1F), analysis by two‐tailed t test. PBS, phosphate‐buffered saline; PH, pulmonary hypertension
