
Figure 2.
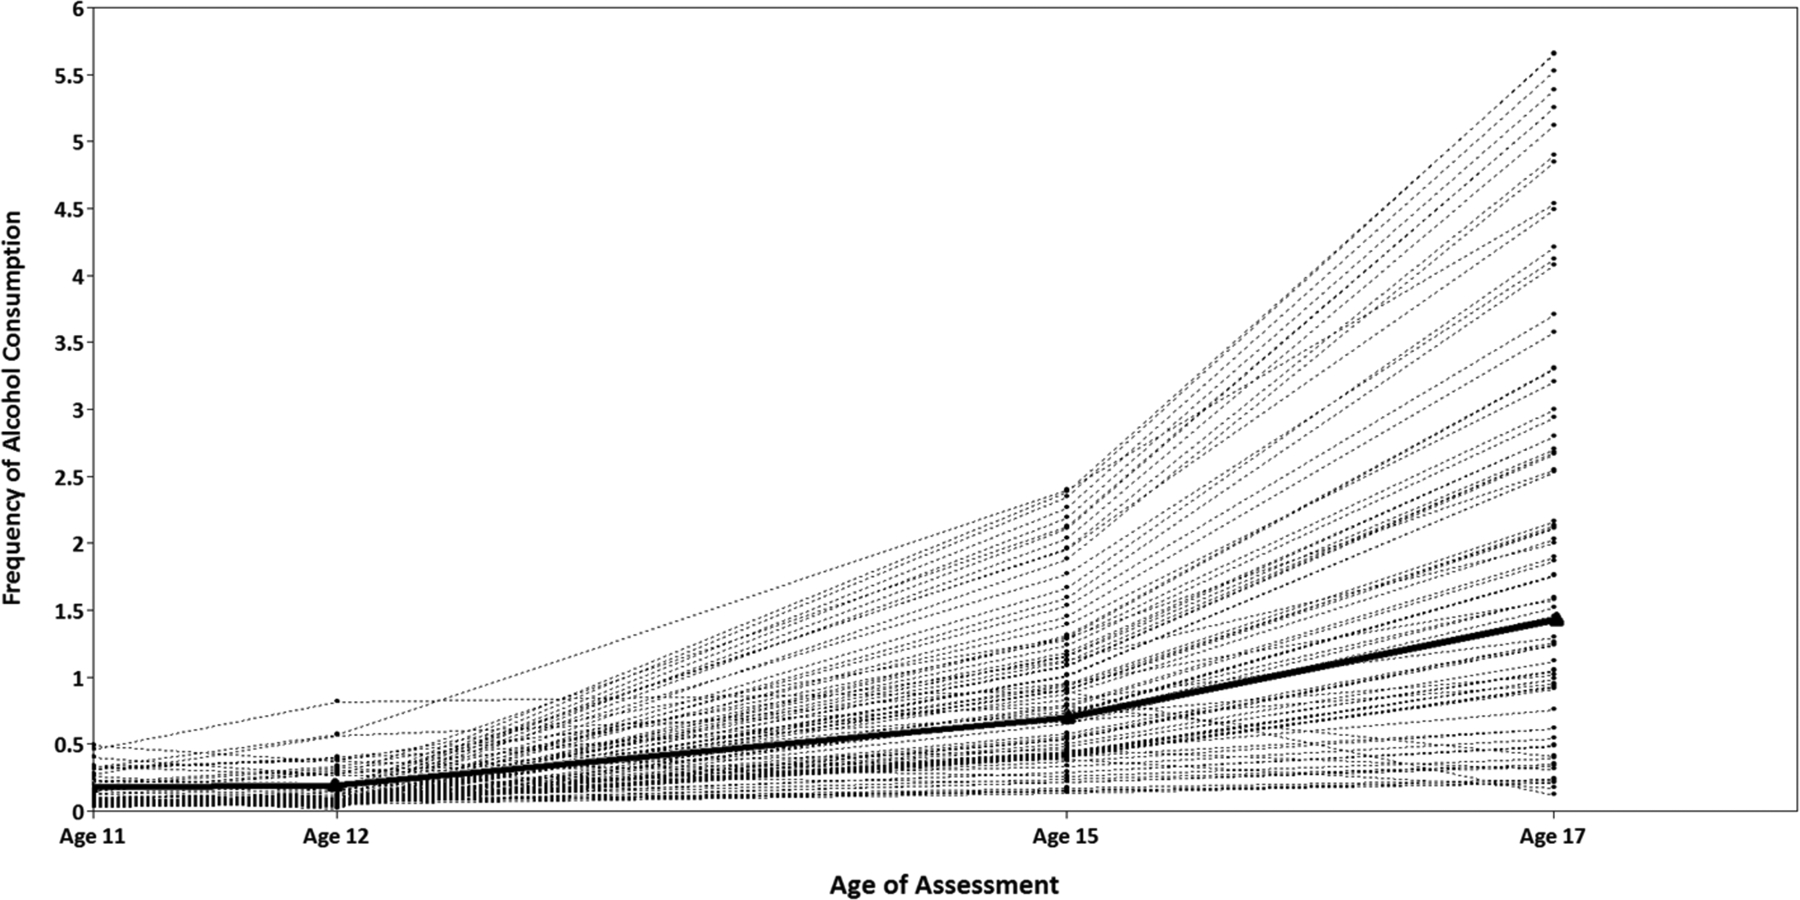
Alcohol use accelerates across adolescence in a sample of low-income males
Note. We used latent growth curve modeling (LGCM) in Mplus version 7.2 and robust maximum likelihood (MLR) estimation based on alcohol frequency scores at ages 11, 12, 15, and 17 (see Supplemental Table 2). We estimated latent factors for the intercept (mean starting level), slope (linear change over time), and quadratic slope (nonlinear change over time/acceleration). A quadratic LGCM showed the best fit to the alcohol use data across adolescence: χ2=1.52, df=1, p= 22, CFI=.99, RMSEA=.04). The model included significant intercept (B=.06, SE=.02, p=.002) and quadratic (B=.04, SE=.01, p<.001) terms, including significance variance for the quadratic term (B=.004, SE=.001, p=.01). The red line represents estimated mean accelerated rate of alcohol use across time in the sample, which was estimated separately and superimposed onto individual curves to aid interpretation of findings. We examined whether latent classes existed within this overall sample trajectory, but found no evidence for distinct classes represented within either a 2- or 3- class solution.