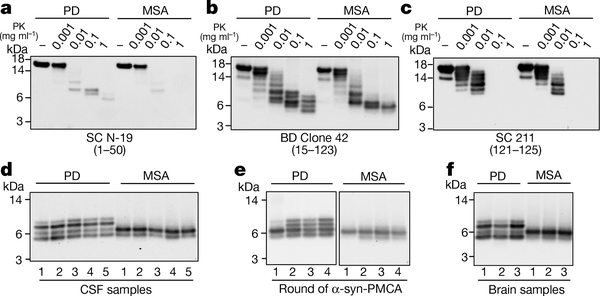
Fig. 2 |. Protease resistance and epitope mapping of α-syn aggregates derived from the CSF or the brain of patients with PD or patients with MSA.
a–c, α-Syn-PMCA products starting from samples of CSF from patients with MSA or patients with PD were incubated without (−) or in the presence of increasing concentrations of proteinase K (PK; 0.001, 0.01, 0.1 and 1 mg ml−1) at 37 °C for 1 h. Samples were subjected to western blotting using three different antibodies against α-syn: N-19 (Santa Cruz), which recognizes the N-terminal region (residues 1–50) of α-syn (a); anti-α-syn clone 42 (BD Biosciences), which is raised against the middle region of α-syn (residues 15–123) (b); and 211 (Santa Cruz), which is reactive against the C-terminal region of α-syn (residues 121–125) (c). Similar results were obtained for three other patients analysed per disease (Extended Data Fig. 4). d, Profiles of digested fragments from five patients in each group, developed with the BD clone 42 anti-α-syn antibody. The results for all of the PD (n = 43) and MSA (n = 43) samples analysed are shown in Extended Data Fig. 5. For the experiments in a–d, we used the aggregates from the second round of amplification. e, Profile of proteinase- K-resistant fragments after serial rounds of α-syn-PMCA. The first round corresponds to direct amplification from the CSF. For the second round of amplification, aggregates produced in the first round were diluted 100-fold into fresh α-syn monomer substrate and a new round of α-syn-PMCA was performed. The assay was then repeated for the third and fourth rounds using amplified α-syn aggregates (1%) from the previous round. As before, amplified aggregates were treated with proteinase K (1 mg ml−1) and blots were developed with the BD clone 42 anti-α-syn antibody. f, Proteinase K resistance profiles of aggregates amplified from the brain of patients with neuropathologically confirmed PD (n = 3) or MSA (n = 3). Molecular weight markers (kDa) are indicated on the left of each blot.

