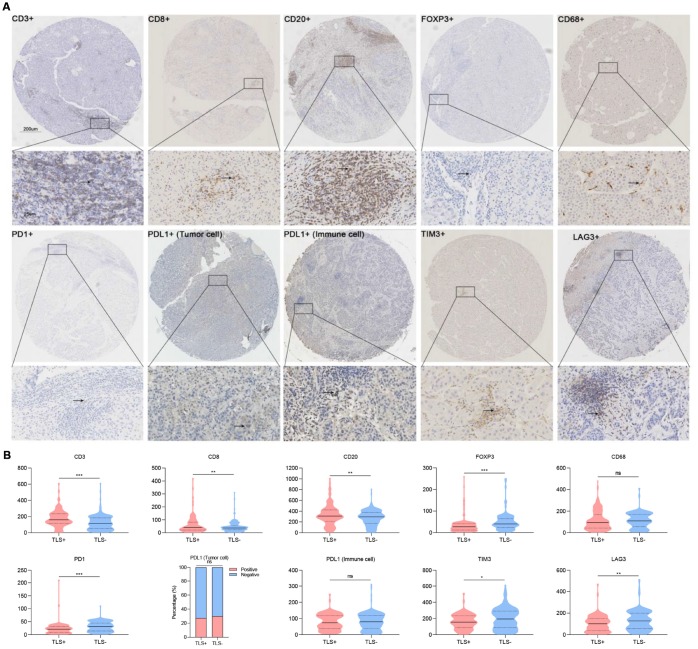
Figure 5.
Association between TLS and immune infiltration. (A) Representative images showing immunohistochemical staining of the nine immune markers in immune cells (CD3, CD8, CD20, FOXP3, CD68, PD1, PDL1, TIM3, LAG3) and tumor cells (PDL1); (B) Statistical analyses showing TLS was associated with increased intratumoral CD3+, CD8+, CD20+ and decreased Foxp3+, CD68+ cells infiltration as well as lower density of PD1+, TIM3+ and LAG3+. TLS, tertiary lymphoid structures; *: P<0.05, **: P<0.01, ***: P<0.001, ns: no significance. Solid lines represent mean values, dotted lines represent quartiles.

