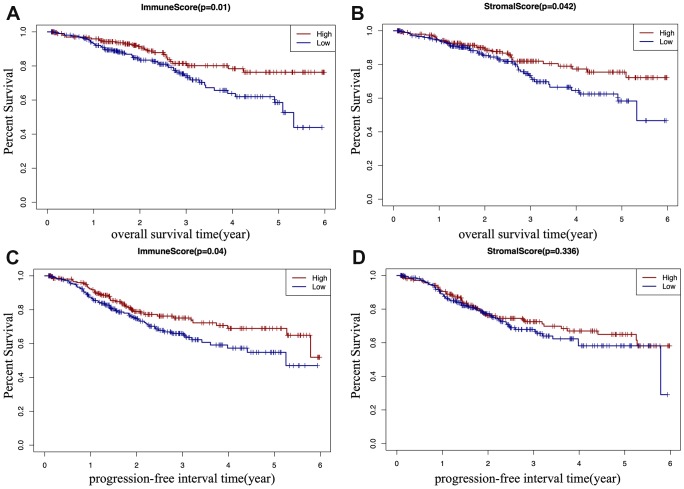
Figure 2.
Kaplan-Meier (KM) survival curve of EC patients based on their immune/stromal scores. Patients were classified into high immune/stromal scores groups and low immune/stromal scores groups. (A) The KM curve of overall survival (OS) time of high and low immune score group. (B) The KM curve of OS time of high and low stromal score group. (C) The KM curve of progression-free interval (PFI) time according to immune scores. (D) The KM curve of progression-free interval (PFI) time according to stromal scores.

