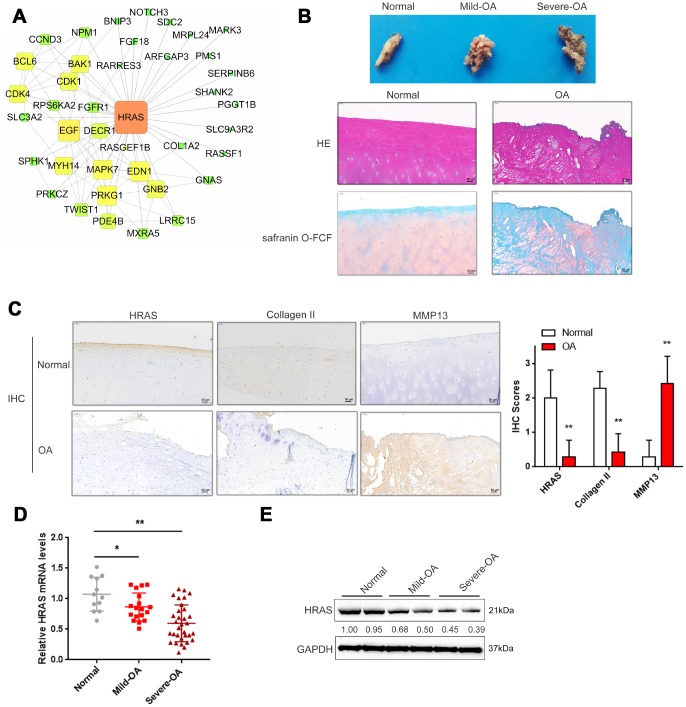
Figure 1.
Screening and validation of HRAS expression in tissue samples. (A) The protein-protein interactions of the differentially expressed genes (both up and down regulated) were retrieved from the String (string-db.org) database and the subnetwork of interactions among MAPK pathway genes, including HRAS and EGF, was chosen and further visualized using Cytoscape software (version 3.4). (B) The macroscopic properties and pathological characteristics of normal and OA tissues were examined using H&E and Safranin O-FCF staining. (C) The localization of HRAS, Collagen II and MMP13 in normal and OA tissues examined using IHC staining. (D) The mRNA expression and protein levels (E) of HRAS in normal, mild OA and severe OA tissues were detected using real-time PCR and immunoblotting assays, respectively. The data are presented as mean ± SD of three independent experiments. *P<0.05, **P<0.01.

