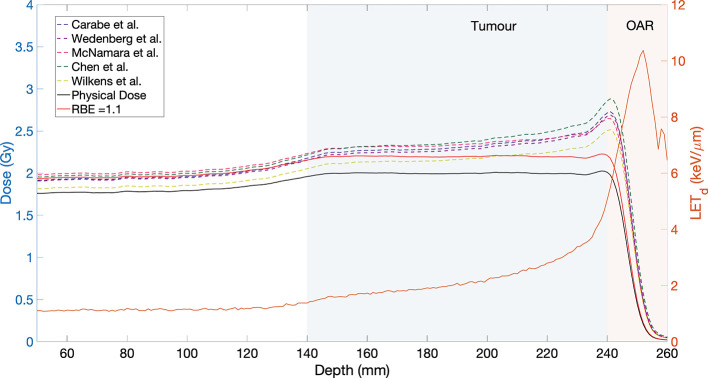
Figure 1.
Biological dose (left hand scale) for five representative phenomenological RBE models for a simulated SOBP with modulation width and range of 100 mm and 250 mm, respectively, for a dose of 2 Gy. The physical dose is shown by the black solid curve, while the physical dose scaled by an RBE of 1.1 is shown by the red curve. The ratio was 2 Gy. The corresponding LETd distribution is also shown (orange solid curve, right hand scale). The case of an OAR distal to the target tumour volume is indicated by the shaded regions. LET, linear energy transfer; OAR, organ at risk; SOBP, spread-out Bragg peak; RBE, relative biological effectiveness.

