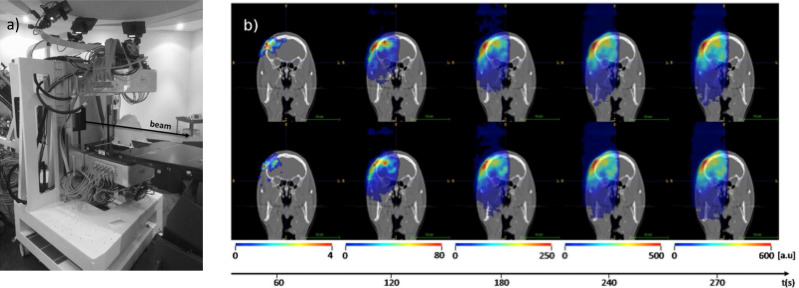
Figure 2.
Prototype in-beam PET scanner at CNAO in measuring position (a) and corresponding dynamically reconstructed activity ((b) in colorwash, left to right: every 60 s up to the final total activity, including a decay of 30 s after irradiation end) superimposed onto the grayscale patient CT for two different proton treatment fractions (top and bottom). Adapted from Ferrero et al.42 PET, positron emission tomography.

