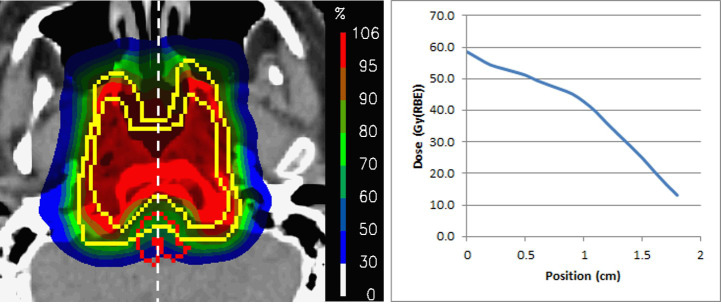
Figure 8.
An example dose distribution to one of the 222 skull base chordomas reported by Weber et al.33 On the right is the dose profile along the white line from the anterior to posterior surface of the brainstem. Note the well-defined dose gradient across the organ, with the posterior surface receiving well under 20 Gy.

