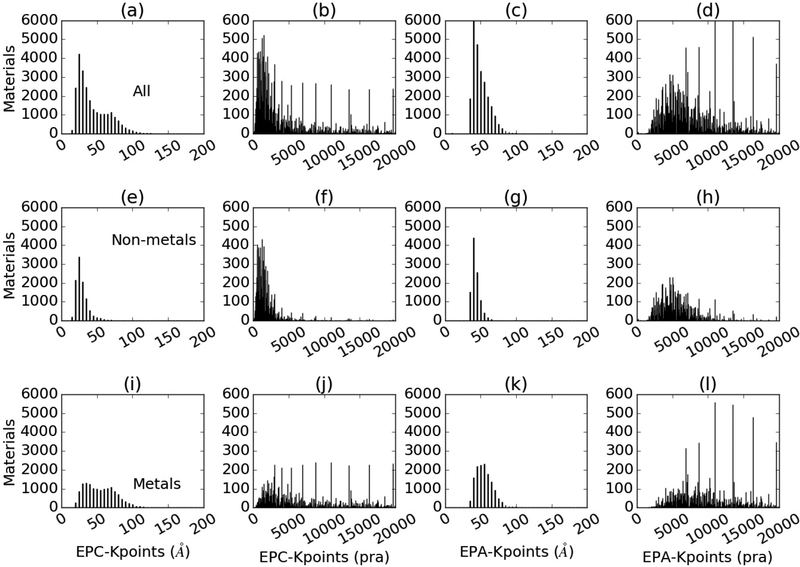
Fig. 2.
Histogram for ranges of the number of k-points. The ‘energy per cell’ and ‘energy per atom’ methods are denoted by ‘EPC’ and ‘EPA’ respectively. EPA values are derived from EPC. Fig. a) shows the length-based k-points distribution of all the materials in the database using EPC, b) the per reciprocal-atom-based distribution of k-points using EPC, c) length-based k-points distribution of all the materials in the database using EPA, d) the per reciprocal atom-based distribution of k-points using EPA. Similar distributions for non-metals are shown in e-h and for metals in i-l. Metals are in general observed to require more k-points.

