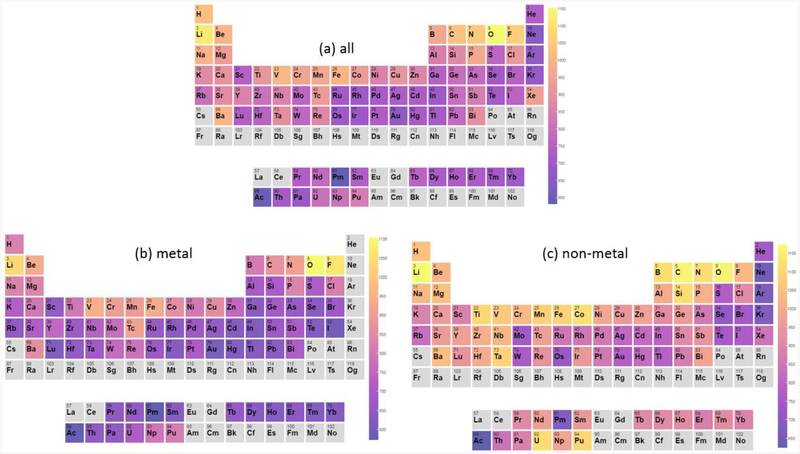
Fig. 7.
Periodic table trend for high/low cut-off-requiring material constituents. The cut-offs of all the materials were projected on individual elements and their average contribution is shown. A) cut-off distribution for all materials, b) cut-off distribution for metals, c) cut-off distribution for all non-metals. The colorbar is in the unit of eV.

