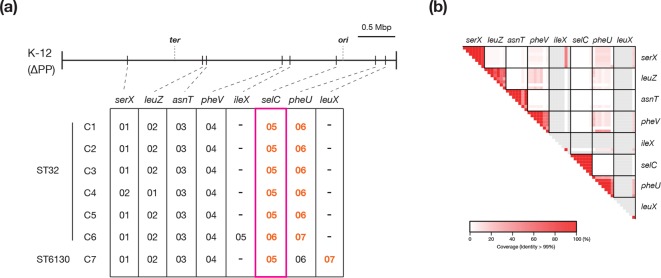
Fig. 3.
Conservation of and variation in the IEs. (a) The conservation of and variation in the IEs in the seven completely sequenced O145:H28 genomes are shown. The integration sites of the identified IEs are shown on the PP-removed chromosome backbone of strain K-12 MG1655 (K-12 ∆PP). Integration sites are indicated by the names of genes in which each IE is integrated. Note that all eight genes are tRNA genes. The LEE (in the selC locus) is indicated by a magenta rectangle. T3SS effector-encoding IEs are indicated in orange and bold. (b) The results of all-to-all nucleotide sequence comparison of the IEs identified in the seven complete genomes are shown. IEs were grouped according to their integration sites. Similar to Fig. 2, coloured boxes indicate each pair of IEs compared, and alignment coverage between two IEs (the percentage of the longer sequence) with >99 % nucleotide sequence identity is indicated as a heatmap. Empty sites (no PP integration) in each strain are indicated by grey boxes.

