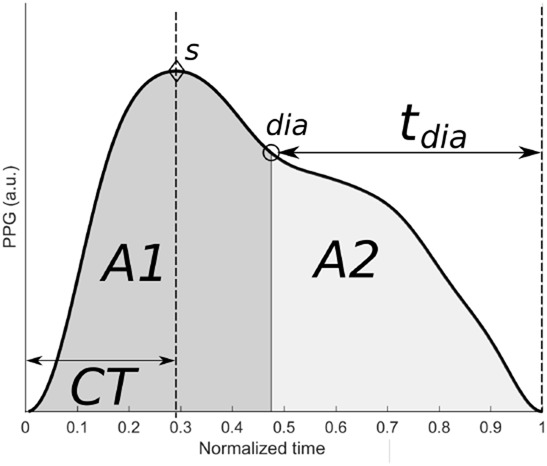
Fig. 4.

Averaged pulse wave, , from ten consecutive pulse waves acquired at baseline together with the fiducial points s and dia, and features CT, , and , which are described in the main text

Averaged pulse wave, , from ten consecutive pulse waves acquired at baseline together with the fiducial points s and dia, and features CT, , and , which are described in the main text