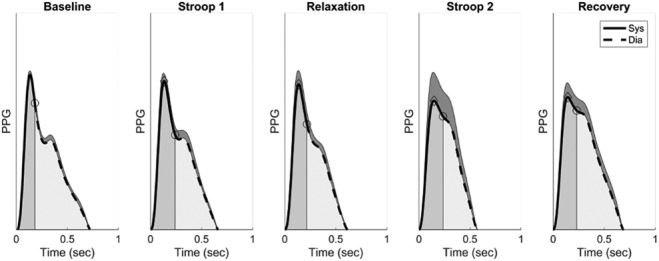
Fig. 5.

Example of arm PPG pulse wave shapes from baseline to recovery. The average pulse wave, , and standard deviation (shaded areas on top of the average waves) are displayed together with systolic (dark shaded areas) and diastolic (light shaded areas) phases. Points indicating systolic peaks (diamonds) and the start of diastole (circles) are also shown
