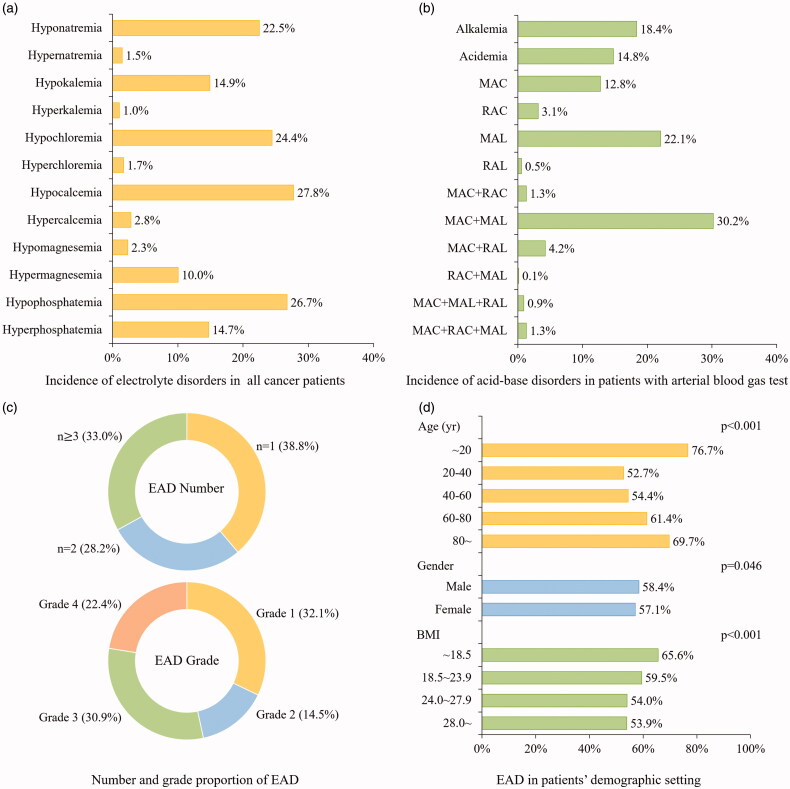
Figure 2.
Epidemiological distribution of electrolyte and acid-base disorders in cancer patients. (a) The incidence of electrolyte disorders was presented on the bar graph in the all cancer patients. (b) The incidence of acid-base disorders was presented on the bar graph in patients with arterial blood gas test. (c) The number and grade of EAD was presented on the annular chart. (d) The incidence of EAD was classified in varied demographic factors and presented on the bar graph with labels. EAD: electrolyte and acid-base disorders; MAC: metabolic acidosis; MAL: metabolic alkalosis; RAC: Respiratory acidosis; RAL: respiratory alkalosis.

