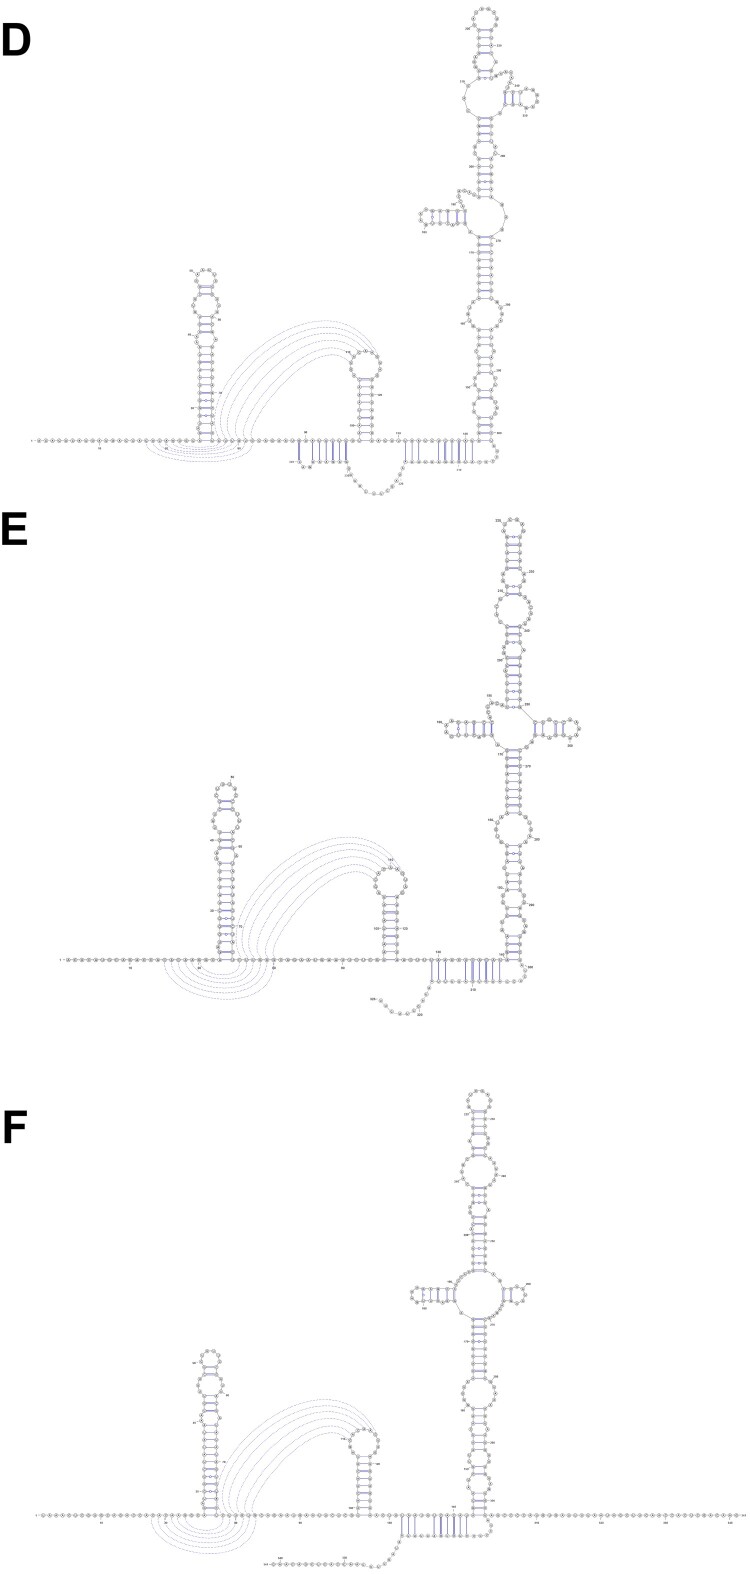
Figure 7.
Secondary structure prediction and comparison in the 5′-untranslated region (UTR) and 3′-UTR using the RNAfold WebServer (with minimum free energy and partition function in Fold algorithms and basic options. The SARS 5′- and 3′- UTR was used as a reference to adjust the prediction results.(A) SARS-CoV 5'-UTR; (B) 2019-nCoV (HKU-SZ-005b) 5'-UTR; (C) ZC45 5'-UTR; (D) SARS-CoV 3'-UTR; (E) 2019-nCoV (HKU-SZ-005b) 3'-UTR; (F) ZC45 3'-UTR.


