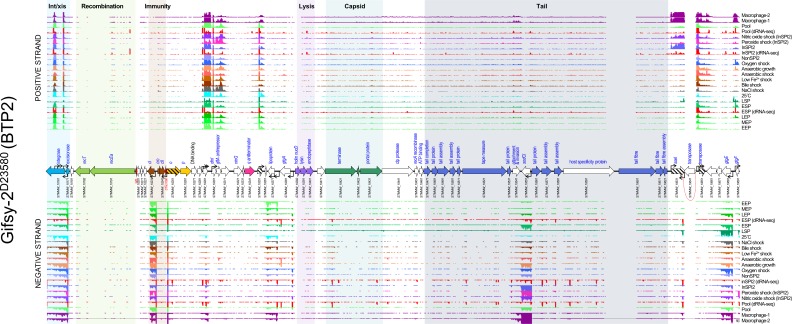
Fig. 2.
The transcriptomic landscape of the Gifsy-2 prophage of S . enterica serovar Typhimurium D23580 across 22 different RNA-seq experiments. RNA-seq and dRNA-seq data are from Canals et al. [20] and Hammarlöf et al. [21]. Each coloured horizontal track represents a different RNA-seq condition (Table S2), the upper panel shows sequence reads mapped to the positive strand and the lower panel reads mapped to the negative strand. The dRNA-seq data are shown in red, and were used to identify the TSSs, which are indicated by curved black arrows on the annotation track. Annotated phage genes are grouped into functional clusters. ncRNAs are annotated with red font. Striped arrows indicate pseudogenes and dotted red lines indicate where ORFs have been disrupted. Due to multiple copies of certain genes, some RNA-seq reads could not be mapped uniquely to the chromosome, these reads were ignored, and so transcriptomic signal is absent from parts of the prophage (e.g. the Gifsy-2 transposase STMMW_10641).

