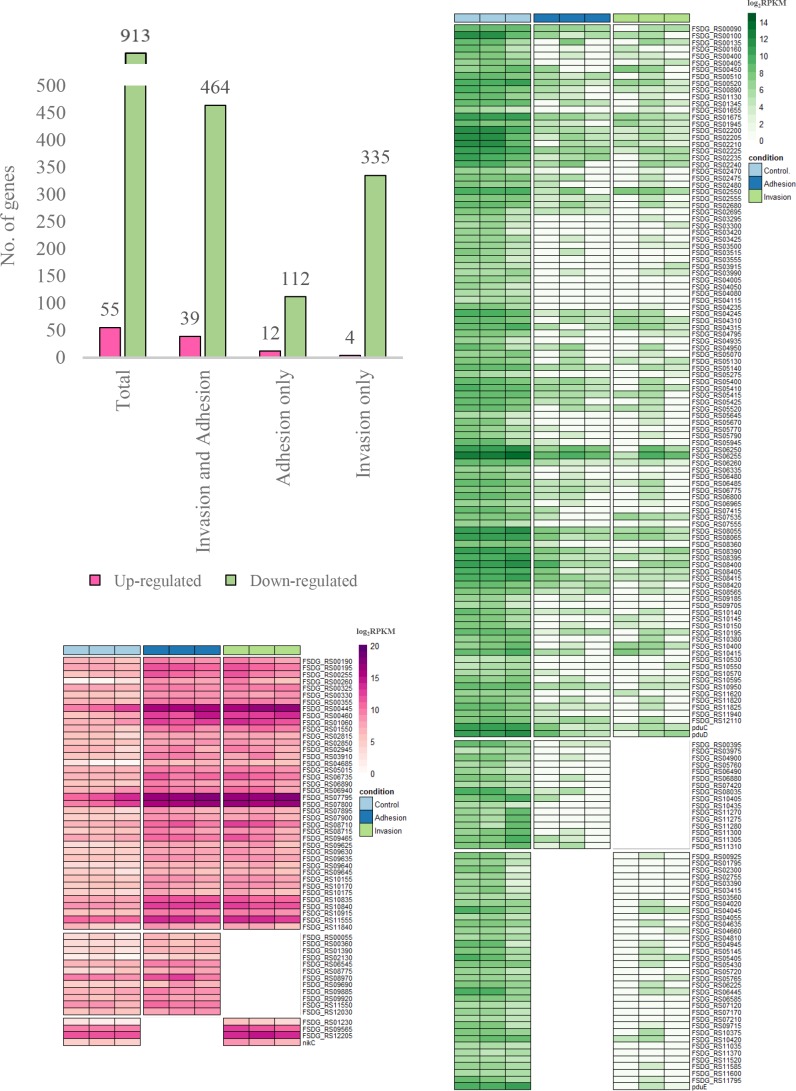
Fig. 2.
Heatmaps depicting the up-regulated and down-regulated genes as determined using the normalized RNA-seq data during both adhesion and invasion of F. nucleatum 7-1 in Caco2 cells. The bar graph represents a summary of the total number of genes found in each condition.

