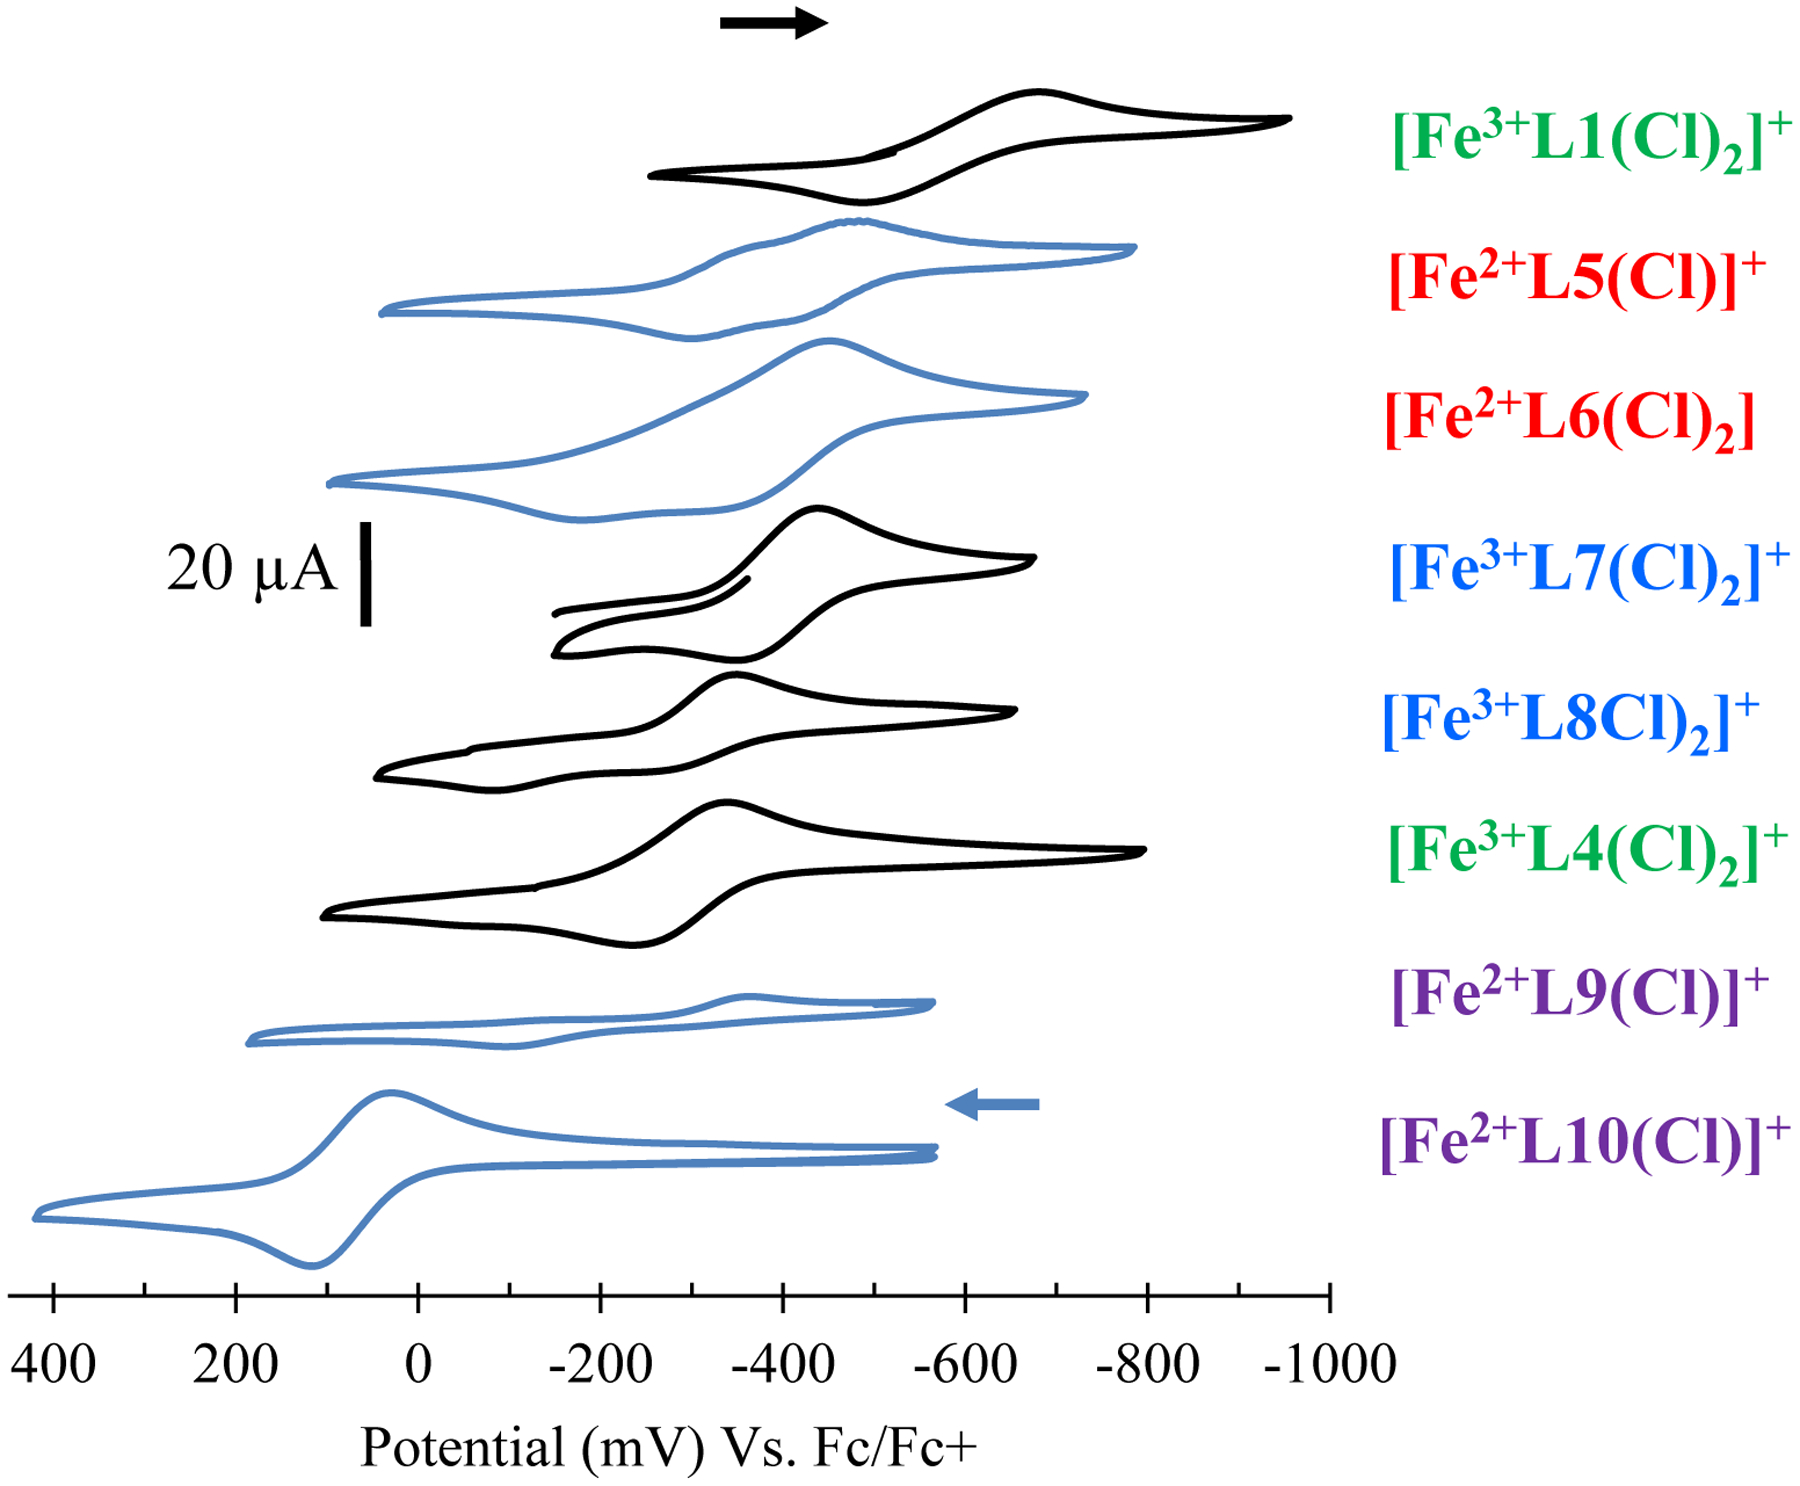
Figure 4.

Cyclic voltammogram overlay of the iron(III/II) couple measured for [Fe3+L1(Cl)2]+, [Fe3+L4(Cl)2]+, [Fe2+L5(Cl)]+, [Fe2+L6(Cl)2], [Fe3+L7(Cl)2]+, [Fe3+L8(Cl)2]+, [Fe2+L9(Cl)]+, and [Fe2+L10(Cl)]+ in DMF containing 0.1 M [Bu4N][BF4] as electrolyte, Ag wire as the reference electrode, a glassy carbon working electrode, and a platinum auxiliary electrode at a scan rate of 100 mV/s. The trace color indicates the initial direction of each scan: Black trace (toward more positive potential), Blue trace (toward more negative potential).
