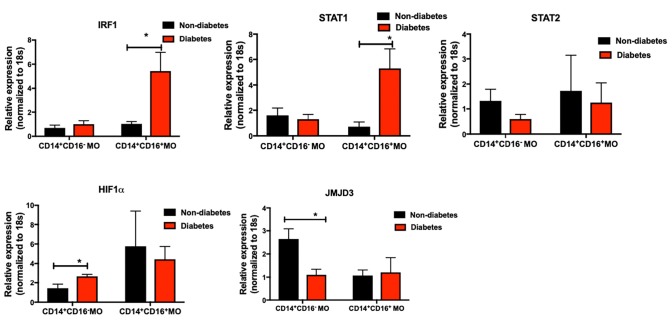
FIGURE 6.
Primary human monocytes were isolated from the circulation of individuals with and without T2DM (at least 5 donors in each group). mRNA was isolated and qPCR was performed to analyze gene expression. (A–E) IRF1, STAT1, STAT2, HIF1α, JMJD3 levels were quantified by qPCR. 18 s was used as the endogenous normalizer. Data presented as mean ± SEM and p less than 0.05 was defined as significant (the symbol “*” indicates p < 0.05).

