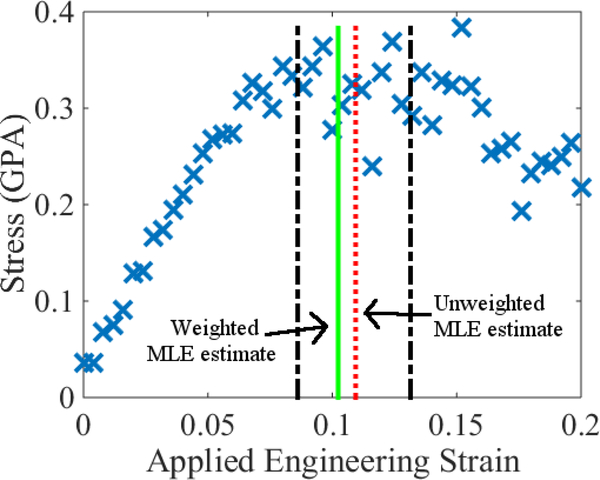
Figure 6:
Stress-strain data in Fig. 1 compared with a hyperbola analysis of the corresponding residual strains. Note that the window of plausible strains (dash-dot black lines) is narrower than the region over which the data appears flat. The vertical, dotted red line denotes the estimate of yield associated with taking ς = 1 in Eq. (4). The vertical, solid green line is associated with the corresponding estimate when ς2 = P(q, ϵ). Vertical error bars are on the order of 3% and are omitted for clarity, since they correspond roughly to the thickness of the lines used to draw the symbols. See Appendix A.

